2021-05-26 Follow up of the Nyiragongo eruption
By 22:00 UTC, 140 earthquakes had been recorded and automatically located in the last 24 hours, with magnitudes ranging from 2.1 to 4.8. Many more earthquakes of smaller magnitude were recoded. Seismicity remained sustained. It caused the collapse of several buildings and cracks in roads. However, it continued to migrate southwards. The partial collapse of the crater that caused the ash cloud on the afternoon of 25 May was confirmed by Sentinel imagery and is clearly visible in the animated figure (see animated figure gif).
Time series 2015-2021 Sentinel images
Time series 2015-2021 of Sentinel images in amplitude. The collapse of the crater is clearly visible on the last image acquired on 26 May.
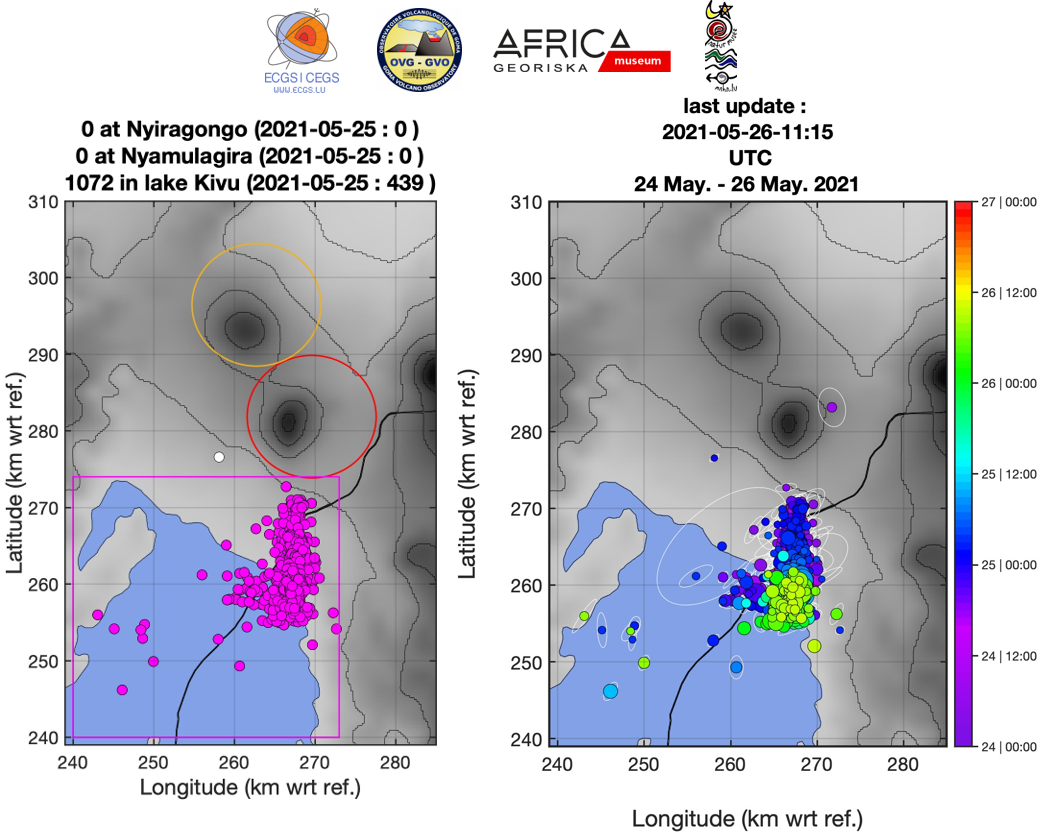
Figure 1: a) Zones for counting seismic events and earthquakes automatically located on 24, 25 and 26 May 2021 (last updated on 26 May at 11:15 UTC); b) Another representation of the automatic earthquake location map on 24, 25 and 26 May (last updated on 26 May at 11:15 UTC) where the colour scale corresponds to the time of origin of each event.
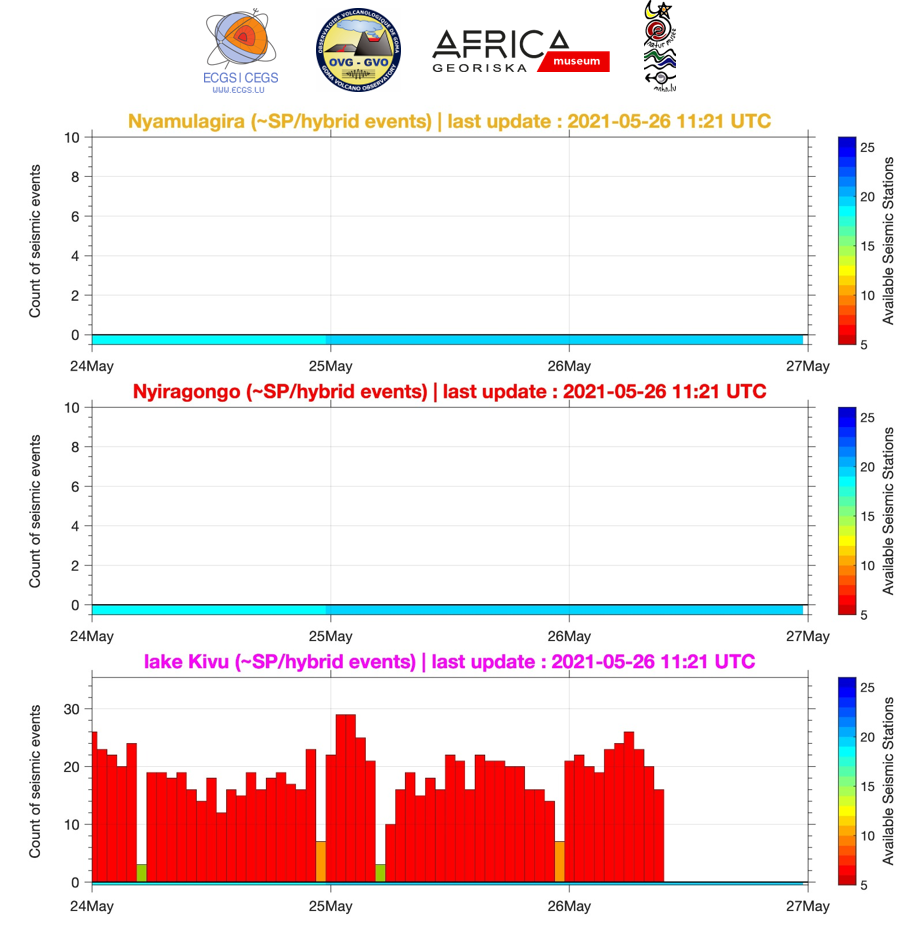
Figure 2: Automatic hourly counts of short-period (SP) and hybrid earthquakes in the three areas marked on the map during the last 3 days (from midnight 24 May; last updated on 26 May at 11:21 UTC), whose locations are shown in Figure 1 a) and b). Each bar is an hourly count.
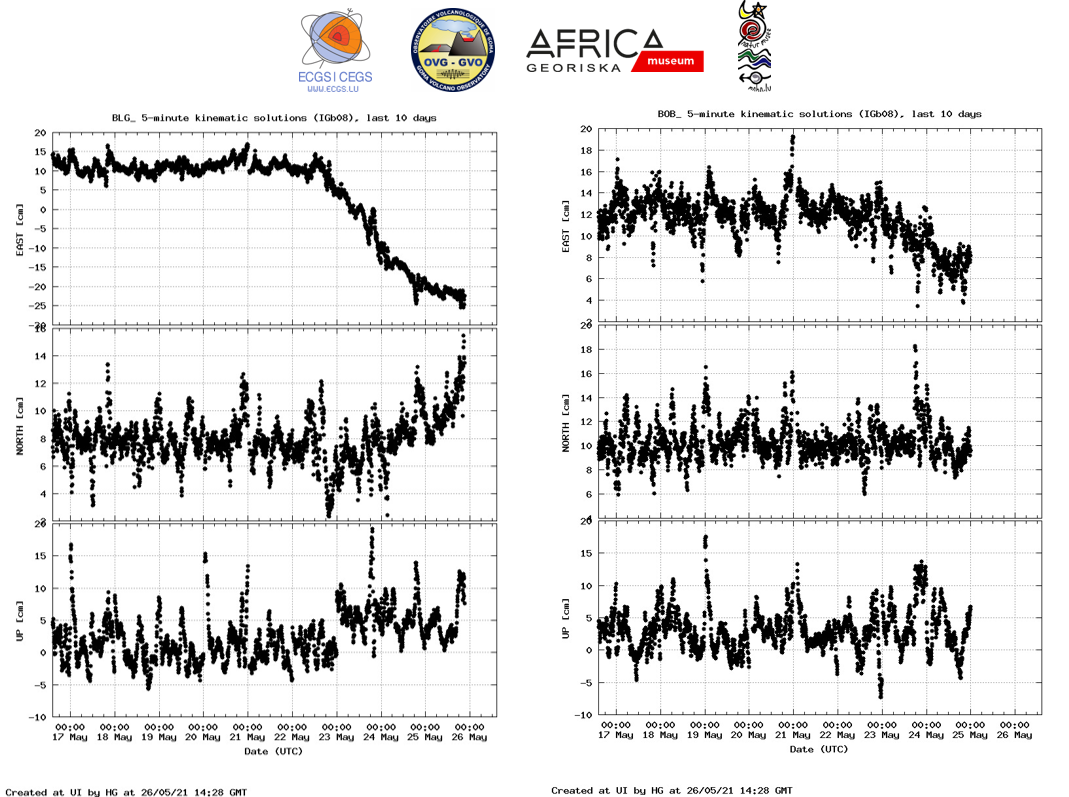
Figure 3: Last 10 days of 5-minutes GNSS kinematics solutions. Left : time series at Bulengo station (BLG), right: time series at Bobandana station (BOB). Up, Middle and Lower curve are resp. E-W, N-S and vertical displacement.
![]()