2021-05-29 Follow up of the Nyiragongo volcano
Current seismic and ground deformation data continue to indicate the presence of magma under the urban area of Goma with extension under Lake Kivu. magma under the urban area of Goma with extension under Lake Kivu.
Seismicity and deformation continue. The number of earthquakes detected in 24 hours is decreasing The number of earthquakes detected in 24 hours is decreasing slightly, as are the deformation rates. However, this decrease in the phenomenology at this stage cannot yet be interpreted as the end of activity. During the During phases of volcanic activity, periods of higher seismic activity often alternate with phases of lower seismic activity often alternate with phases of lower seismicity. Seismicity above the baseline is always recorded.
These observations are always consistent with the presence of magma at depth.
Ash fallout can occur as a result of the collapse of parts of the crater. parts inside the crater. The data on the stability of Lake Kivu do not currently show any significant change (the latest available data is from 27 May 2021).
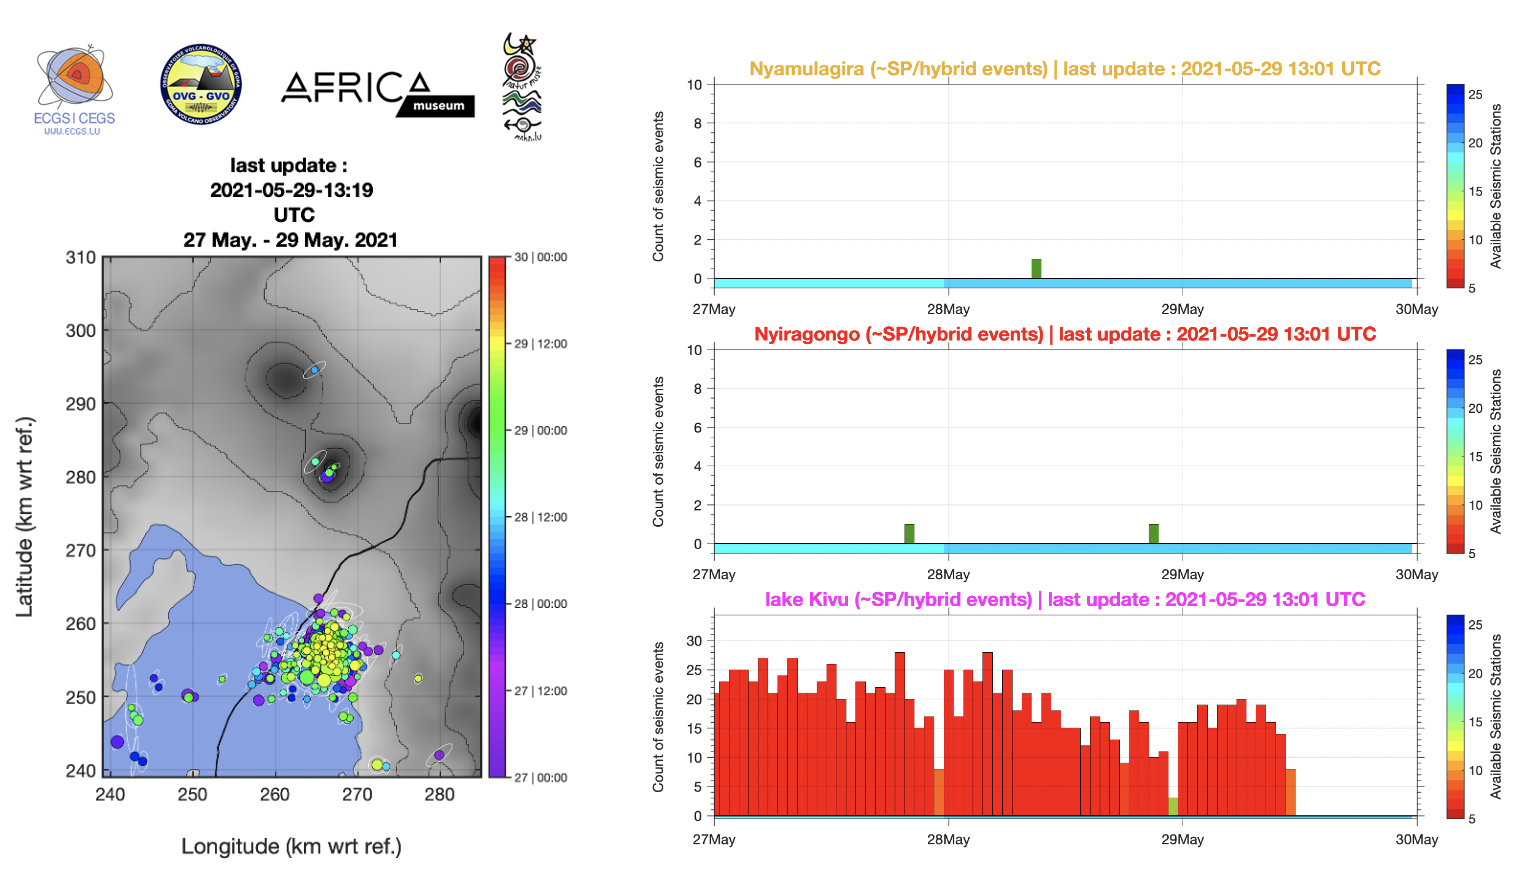
Figure 1: left) Zones for counting seismic events and right) automatic hourly counts of short-period (SP) and hybrid earthquakes in the three areas marked on the map during the last 3 days (from midnight 27 May; last updated on 29 May at 13:01 UTC). Each bar is an hourly count.
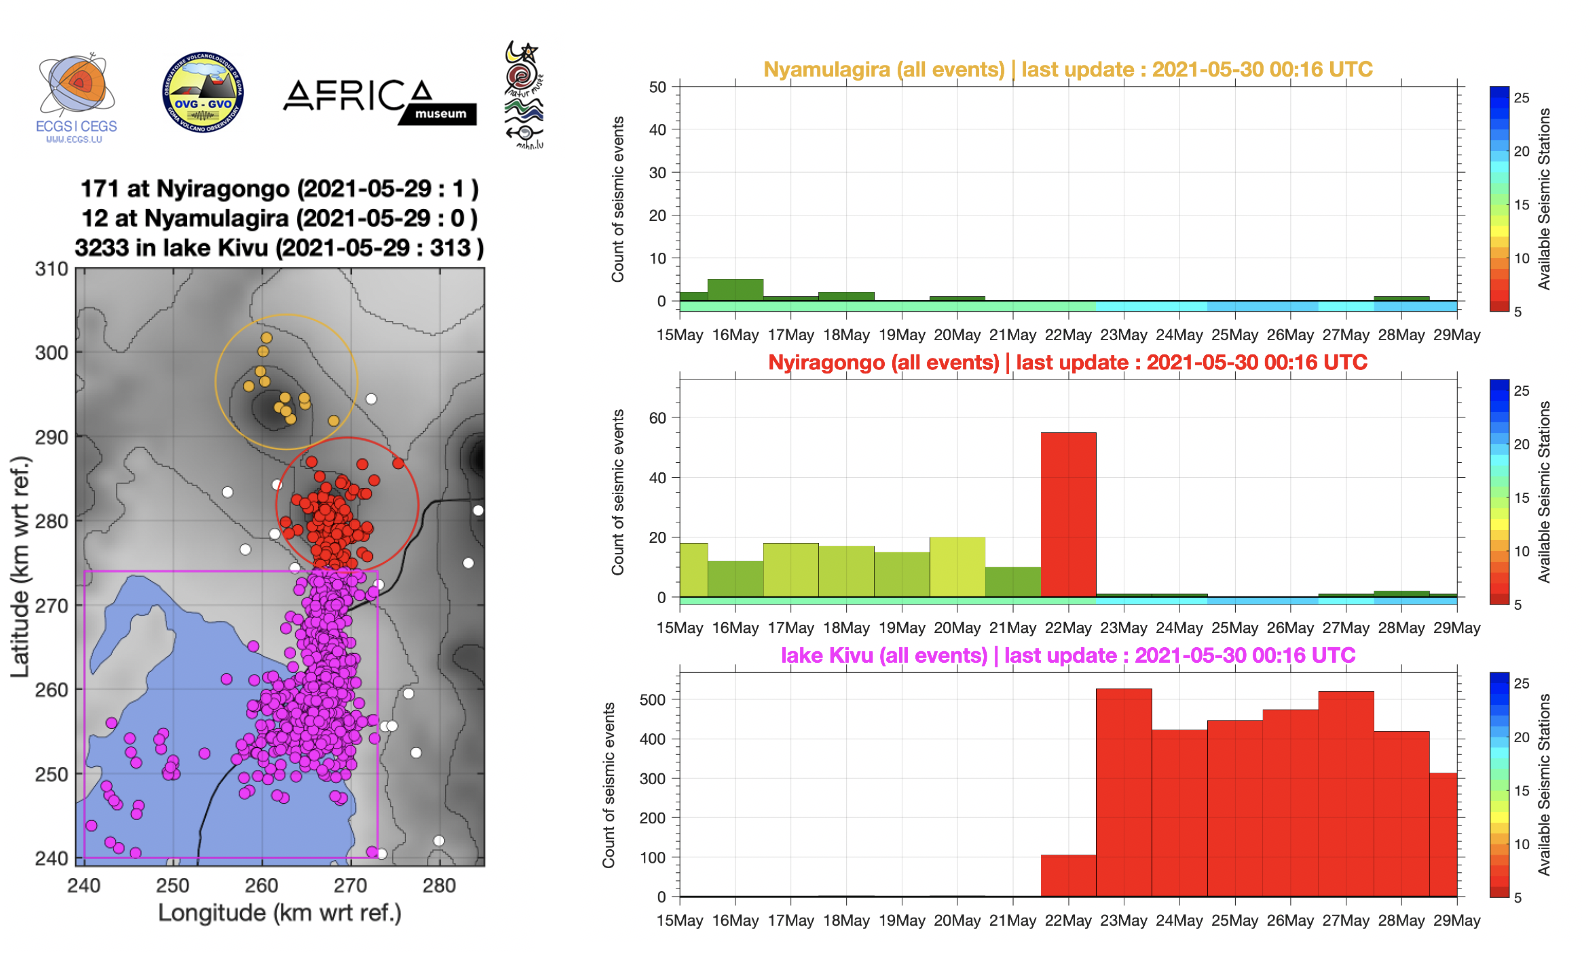
Figure 2: left) Zones for counting seismic events and right) automatic daily counts of all detected earthquakes in the three areas marked on the map during the last 14 days (from midnight 15 May; last updated on 30 May at 00:16 UTC). Each bar is an daily count.
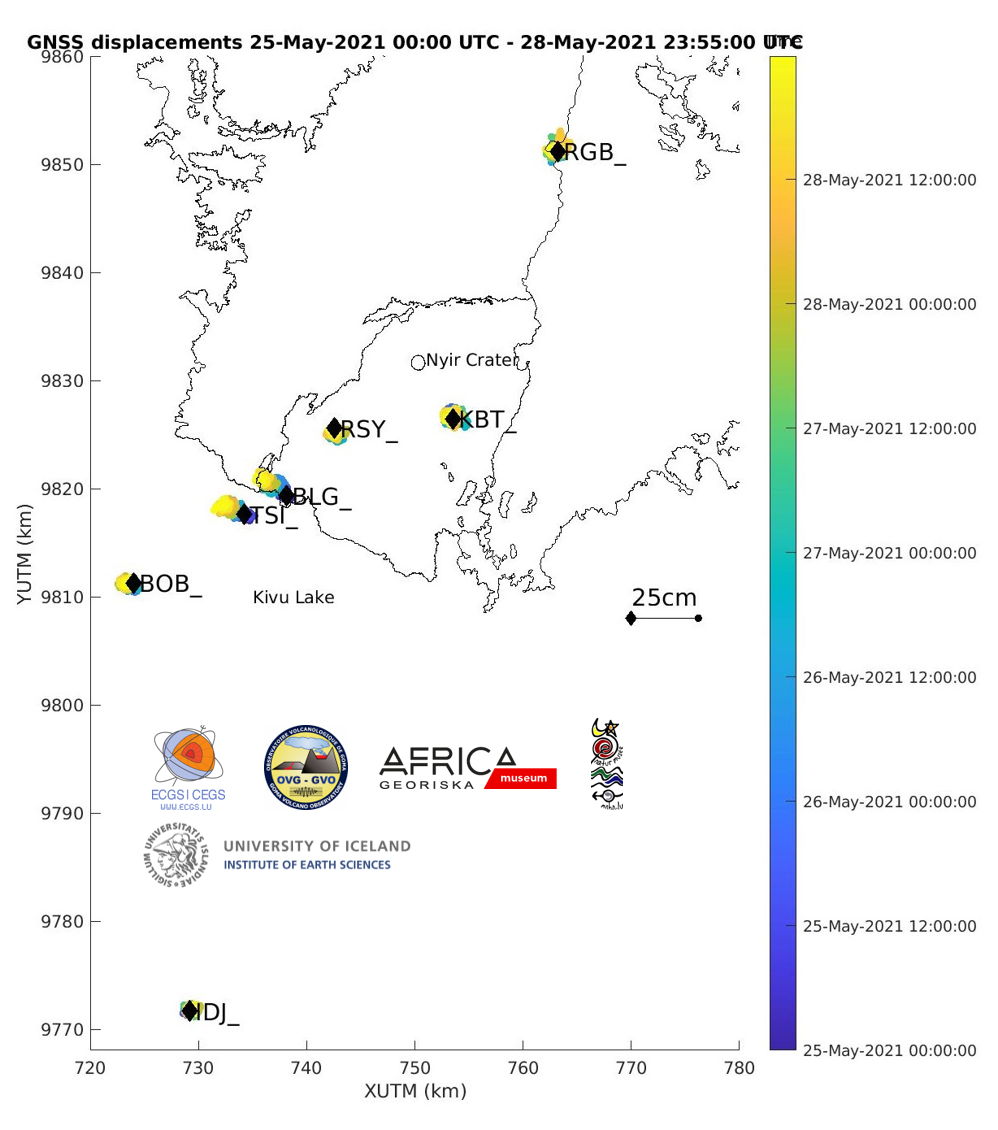
Figure 3: Map showing the horizontal displacements recorded by the GNSS stations of the KivuGNet network. Processing epoch by epoch, 1 point every 5 minutes between 25-05-2021 00:00 and 28-05-2021 23:55. The black contours mark the historical lava fields of Nyiragongo and Nyamulagira. Data processing by H. Geirsson (univ. Iceland).
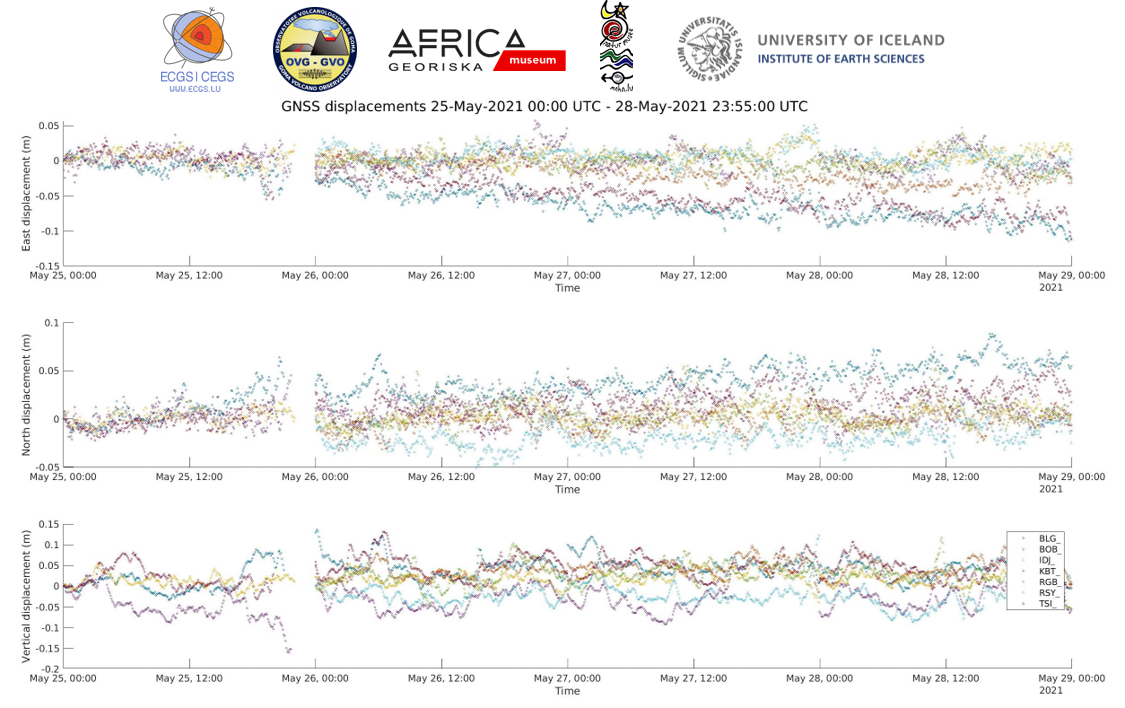
Figure 4: Time series of east-west, north-south and vertical displacements between 25-05-2021 00:00 and 28-05-2021 23:55 for the 6 stations shown on the map above. Data processing by H. Geirsson (univ. Iceland).
![]()