2021-06-05 Follow up of the Nyiragongo eruption
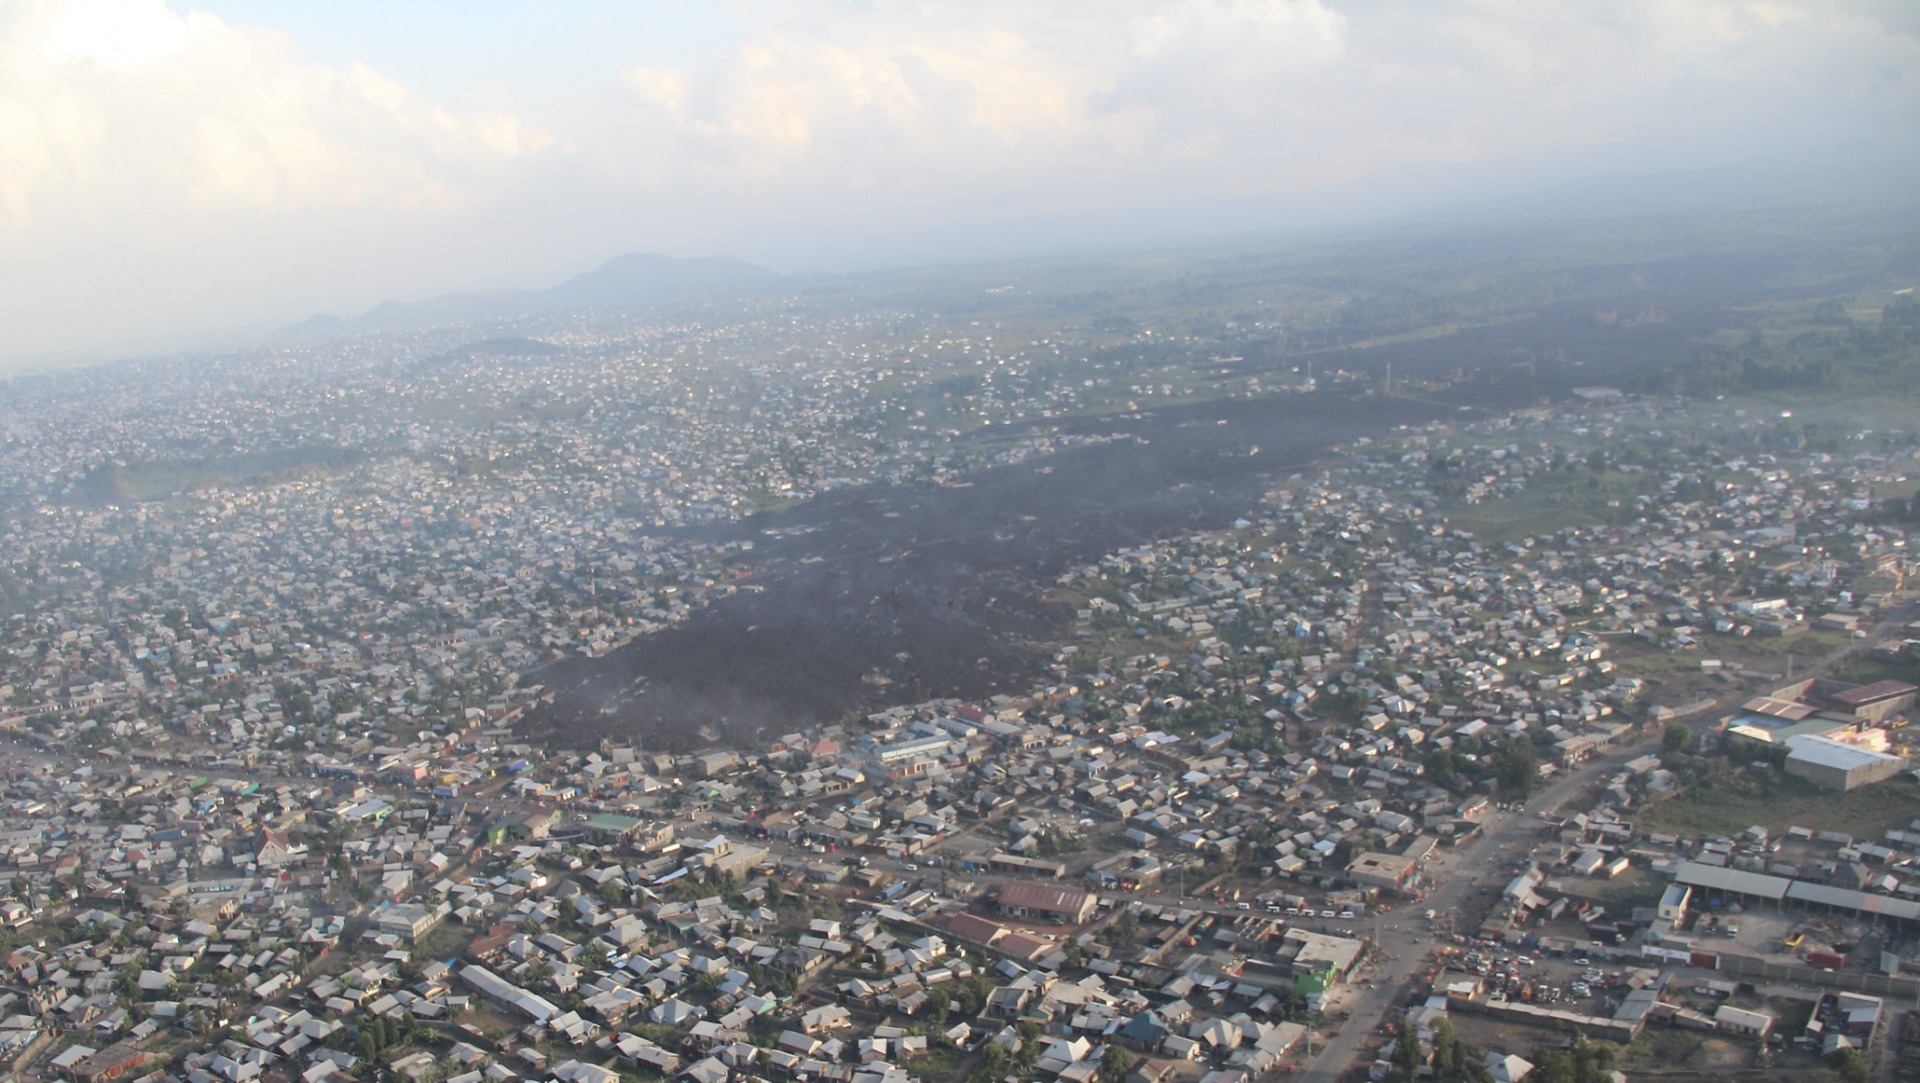
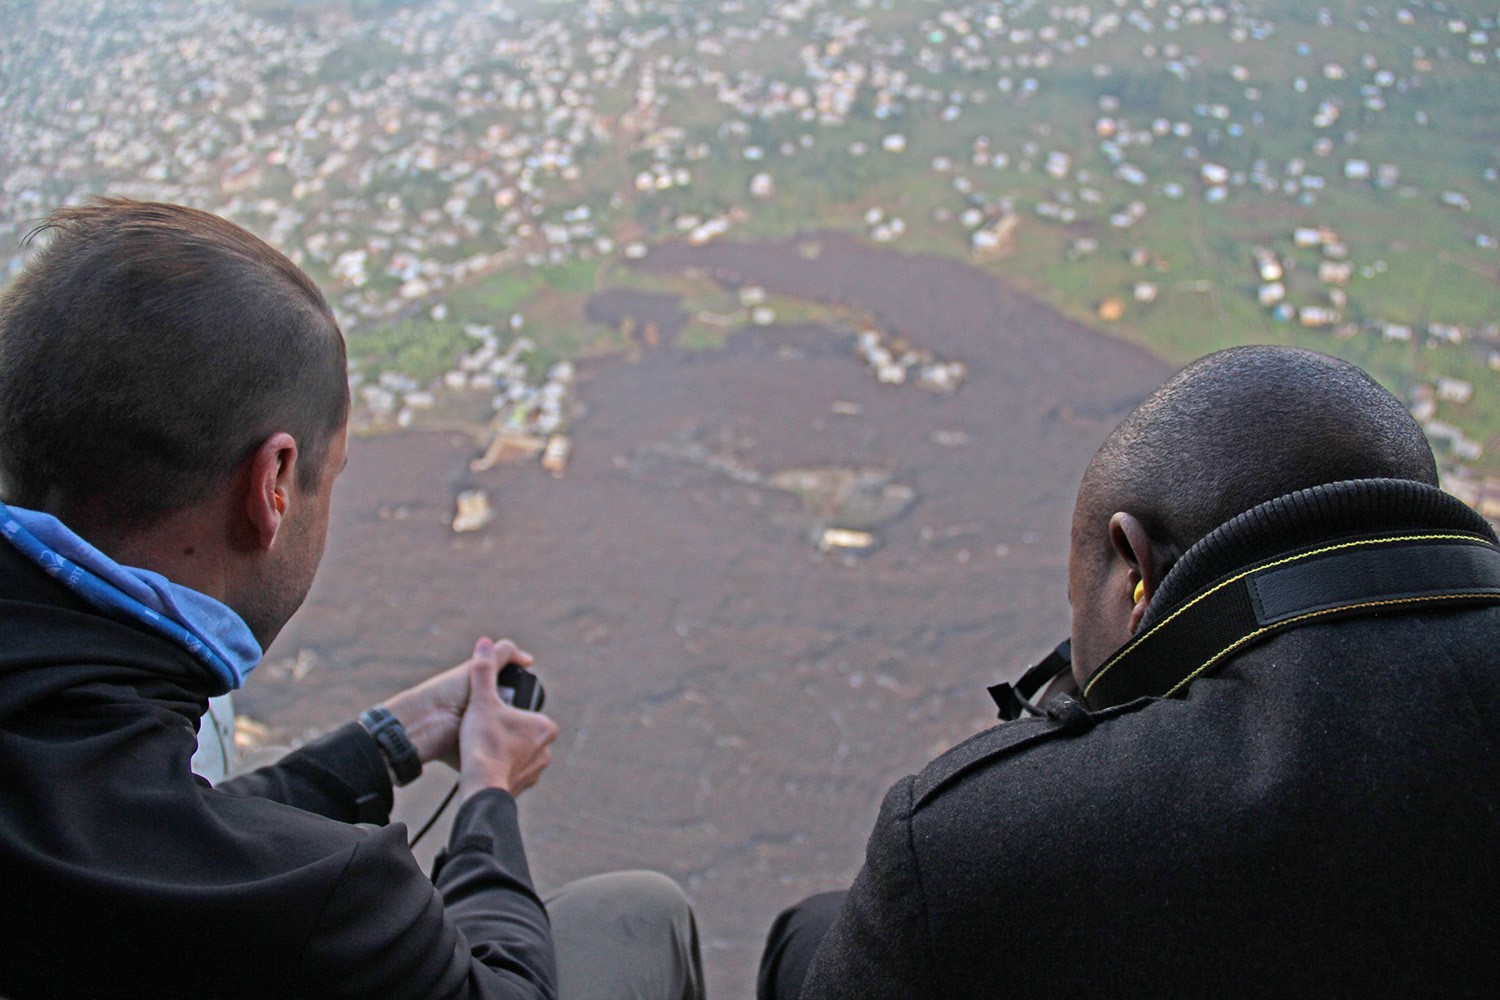
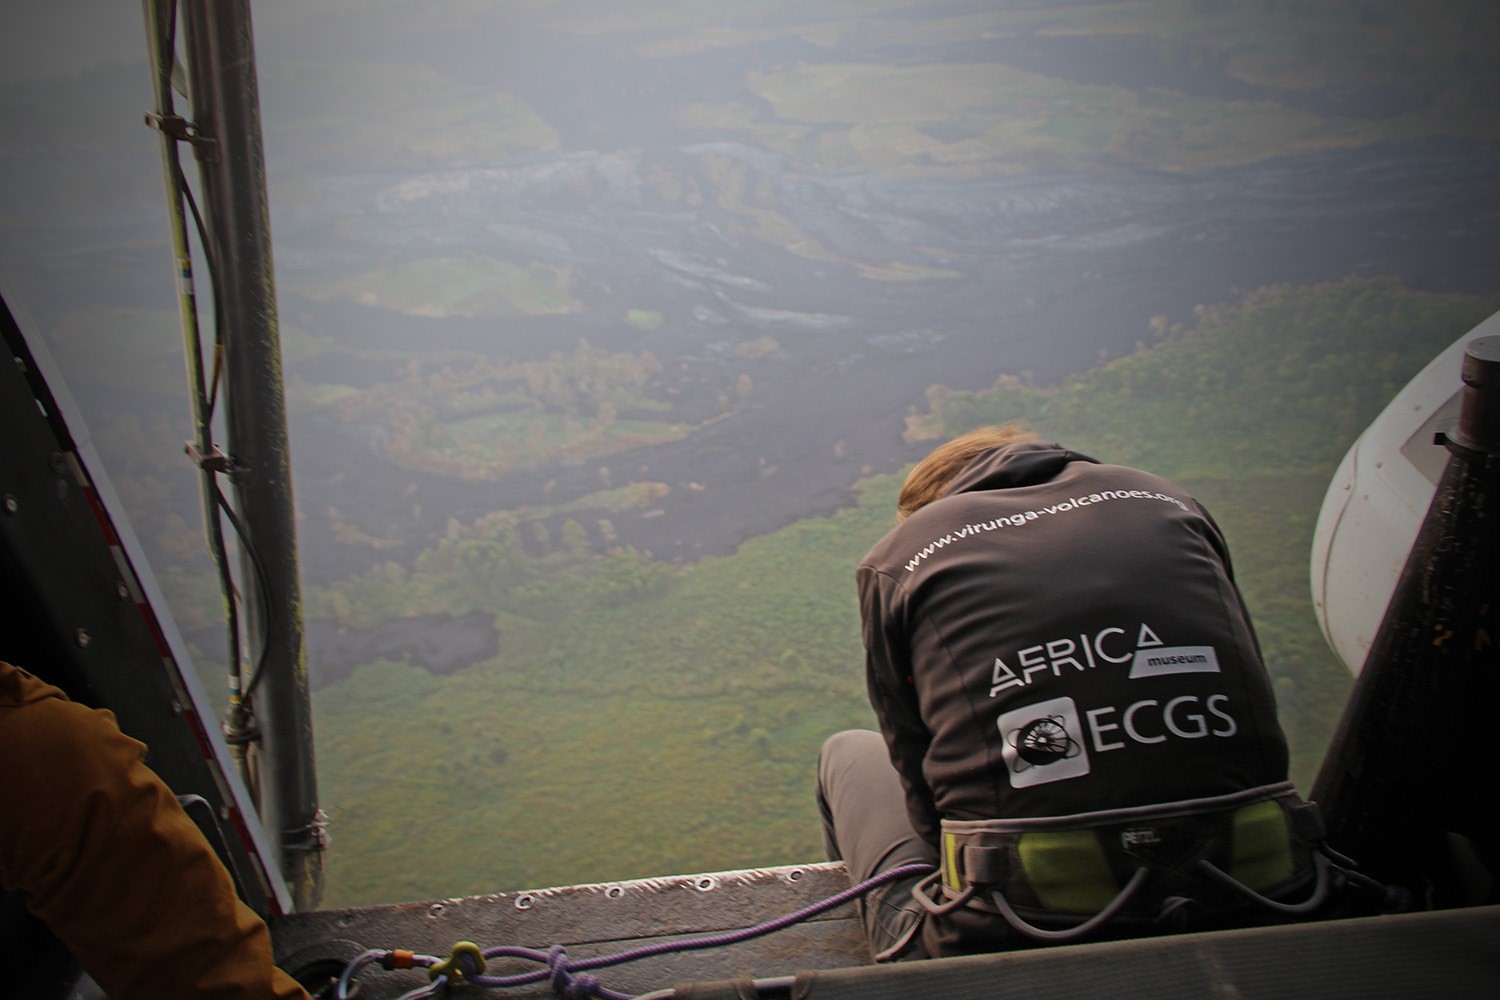
Figure 1: The 22 May lava flow from the sky: several villages devastated in the Nyiragongo administrative territory.
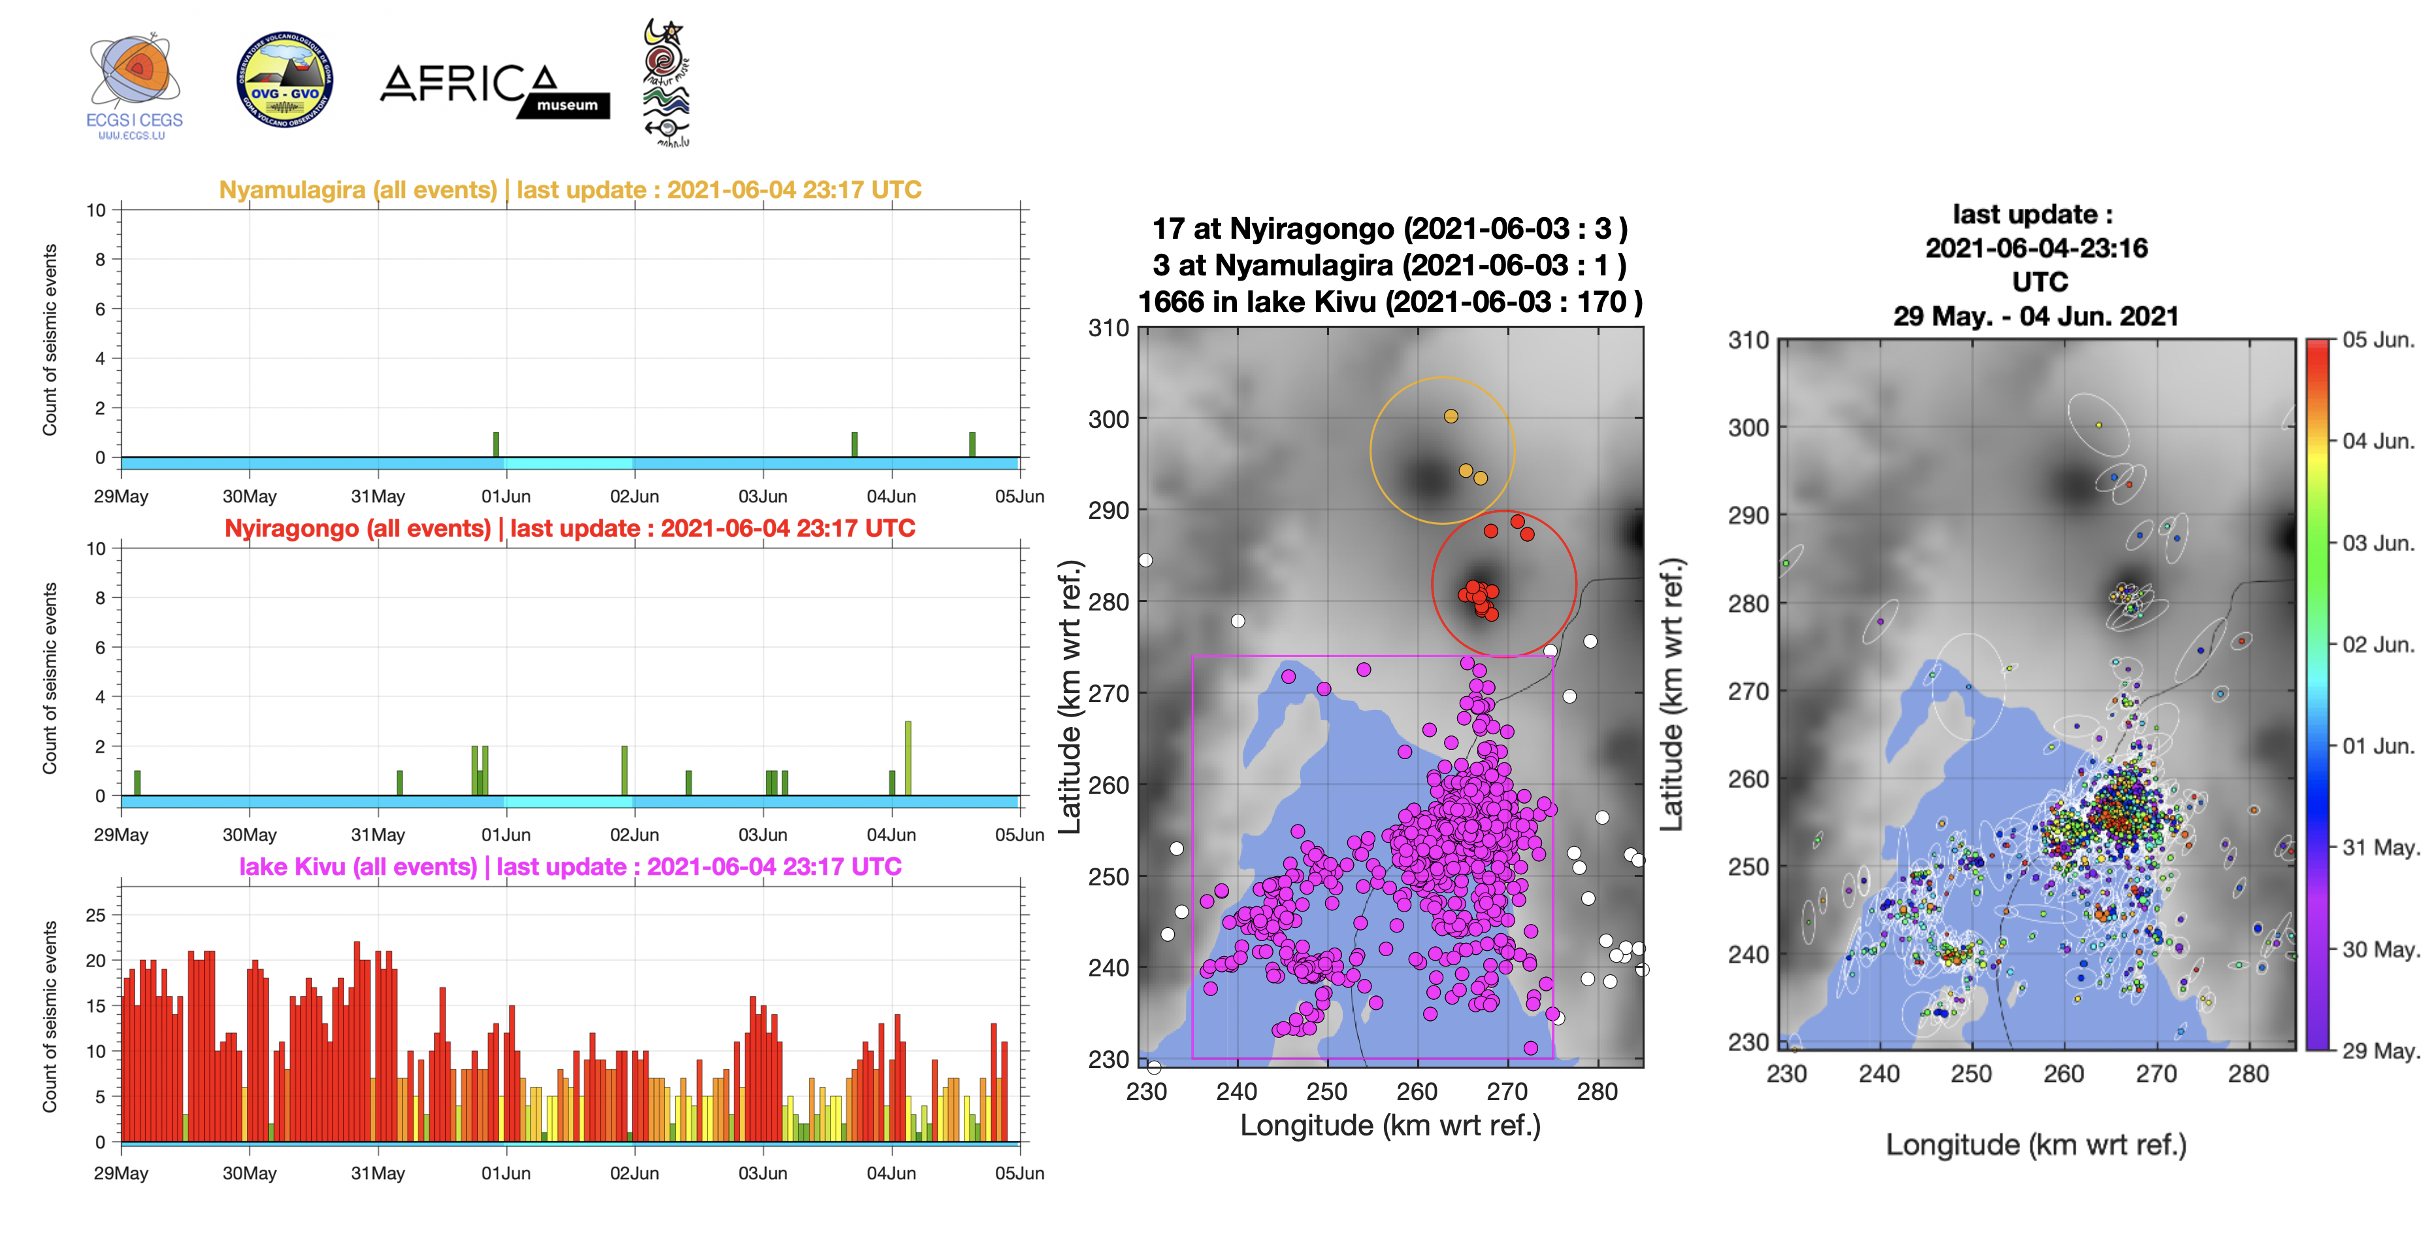
Figure 4: Automatic hourly counts of earthquakes (i.e., each bar is an hourly count) during the last 7 days (from midnight 29 May; last updated on 3 June at 23:17 UTC), whose locations are shown on the maps according to the 3 zones for counting seismic events (Nyamulagira, Nyiragongo and lake Kivu/Goma-Gisenyi) and to their origin times, respectively.
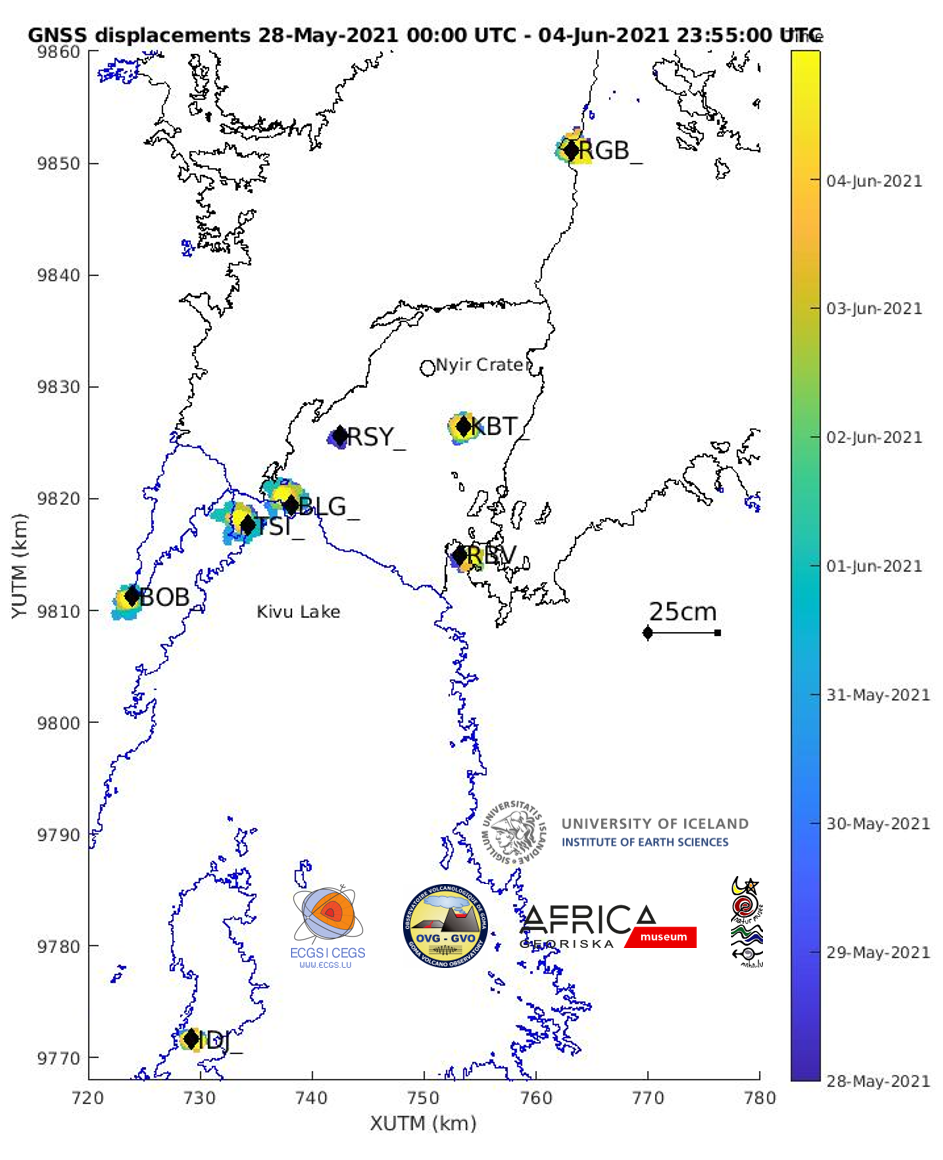
Figure 5: Map showing the horizontal displacements recorded by the GNSS stations of the KivuGNet network. Processing epoch by epoch, 1 point every 5 minutes between 28-05-2021 00:00 and 04-06-2021 23:55. The black contours mark the historical lava fields of Nyiragongo and Nyamulagira. Data processing by H. Geirsson (univ. Iceland).
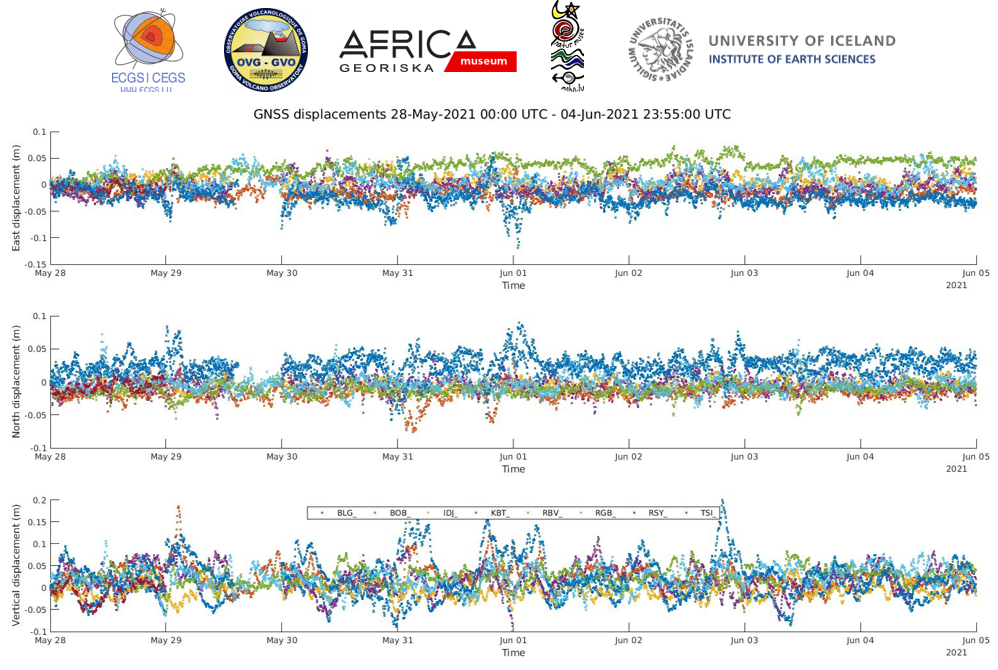
Figure 6: Time series of east-west, north-south and vertical displacements between 28-05-2021 00:00 and 04-06-2021 23:55 for the 6 stations shown on the map above. To date, no significant displacement has been recorded by the GNSS stations. Data processing by H. Geirsson (univ. Iceland).