2021-05-24 Follow up of the Nyiragongo eruption
At the eruption onset, the lava flowed eastwards and cut the N2 road (Goma- Rutshuru) near Kibati. Next, a new lava flow went southward and reached inhabited areas in Buhene. This lava flow stopped at 1.25 km from the international Airport of Goma during the night of May 22-23. As recorded on the KivuSNet seismic network and the KivuGNet geodetic network maintained by GVO, ECGS/MNHN and MRAC (see figures below), no precursors happened before the opening of the eruptive fissures on the volcano's flanks. This lack of precursors prevented any forecasting. At the time of writing, surface activity has ceased. However, an ongoing seismic swarm with several strong earthquakes (M3-4 and one M5) are still recorded on the KivuSNet seismic network. More information to come soon.
![]()
Figure 1: Left: Definition of zones for seismic event counts. The areas around the Nyamulagira and Nyiragongo volcanoes are indicated with yellow and red circles, respectively, and the magenta area includes Lake Kivu and the city of Goma. Right: Automatic daily counts of short-period (SP) and hybrid earthquakes in the three areas marked on the map during the last 101 days (from February 12). Each bar is a daily count. Apart from a swarm on April 20-21, 2021 at Nyamulagira composed mostly of long-period (LP) events (thus with very few earthquakes that could be qualified as hybrid), no abnormal hybrid or short-period earthquake activity occurred before the start of the Nyiragongo eruption on May 22, 2021 around 16:15 UTC.
![]()
Figure 2: a) Zones for counting seismic events and earthquakes automatically located on 22, 23 and 24 May 2021 (last updated on 24 May at 16:50 UTC); b) Another representation of the automatic earthquake location map on 22, 23 and 24 May (last updated on 24 May at 16:50 UTC) where the colour scale corresponds to the time of origin of each event. The progression of seismicity from the first eruptive fissure at the foot of Nyiragongo to the south of Goma (DRC) / Gisenyi (Rwanda) is clearly visible.
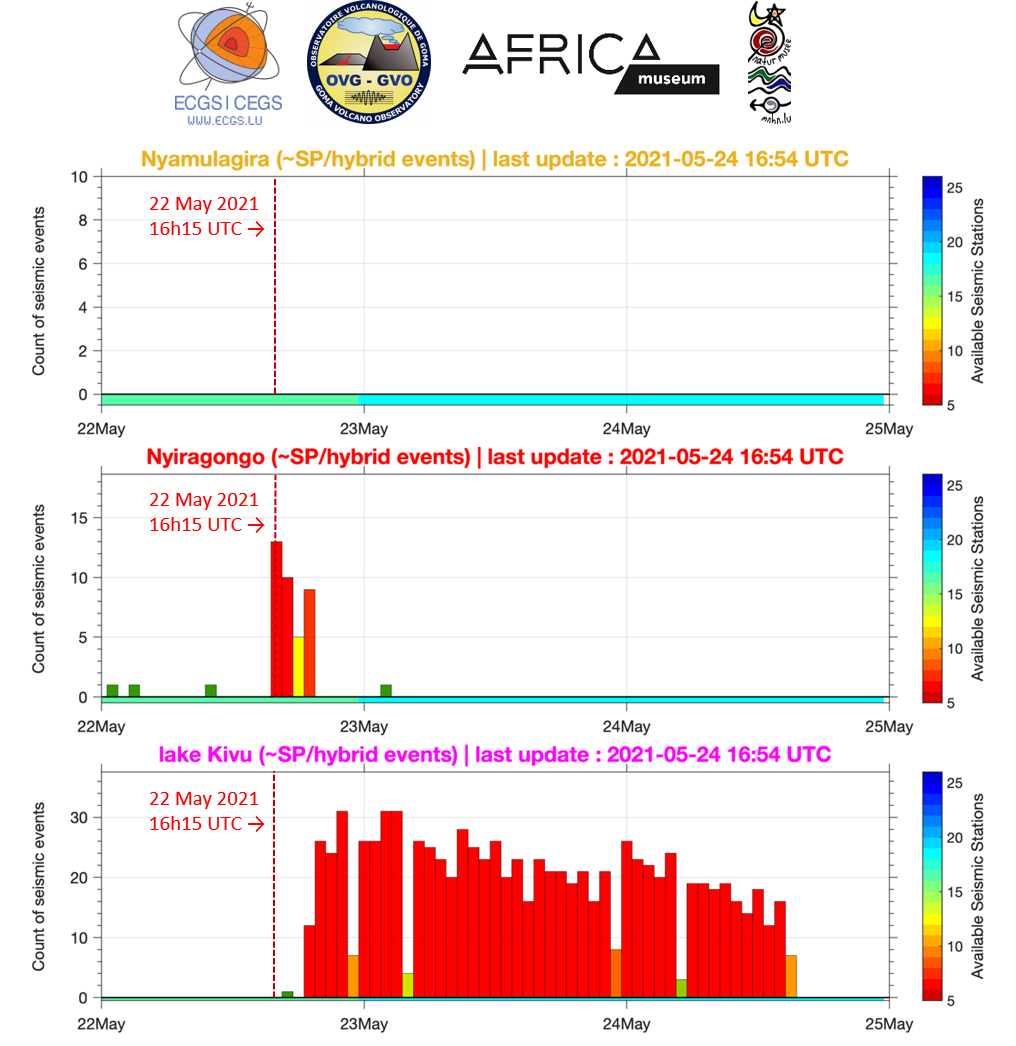
Figure 3: Automatic hourly counts of short-period (SP) and hybrid earthquakes in the three areas marked on the map during the last 3 days (from midnight 22 May; last updated on 24 May at 16:54 UTC), whose locations are shown in Figure 2 a) and b). Each bar is an hourly count. The first seismic and acoustic peaks on 22 May at around 16:15 UTC occurred almost simultaneously with the first visual observations of the eruption at the surface, observed between 16:00 and 17:00 UTC.
![]()
Figure 4: Seismic and Infrasound (Acoustic) amplitude measurements since 21 May 2021 (10-minute windows + moving average, filtered between 2-10 Hz) at Kibati station, about 6 km away from Nyiragongo's summit on its eastern flank.
![]()
Figure 5: Ground displacements measured by the Kibati GNSS station of the KivuGNet geodetic network on 22-05-2021: approximately 45 cm eastward (green) and 10 cm northward. The kinematic treatments used are not precise enough to interpret the vertical displacement (blue) measured. Measured deformation starts around 16h45, that is shortly after the onset of the seismicity (GNSS processing performed by H. Geirsson, Univ. Iceland).
![]()