2021-05-25 Follow up of the Nyiragongo eruption
No return to eruptive activity has been observed. However, the seismicity remains very intense and felt by the population.
More than 130 earthquakes of magnitude 2 to 5 were recorded in 24 hours as well as a large number of smaller earthquakes. Numerous reports of damages to houses and roads as well as multiple cracks are reported by the local population. The seismic swarm extended to Lake Kivu.
Preliminary models show that the deformation recorded by the KivuGNet stations since the beginning of the eruption (last data processed on 24/05/2021) is compatible with the opening (~1m) and migration of a shallow dike (0-4km) from the southern flank of Nyiragongo volcano towards the south over about 10km. These initial estimates are likely to evolve with the analysis of further data.
A column of ash was observed above the volcano and ash falls were reported in town this morning, Tuesday 25 May.
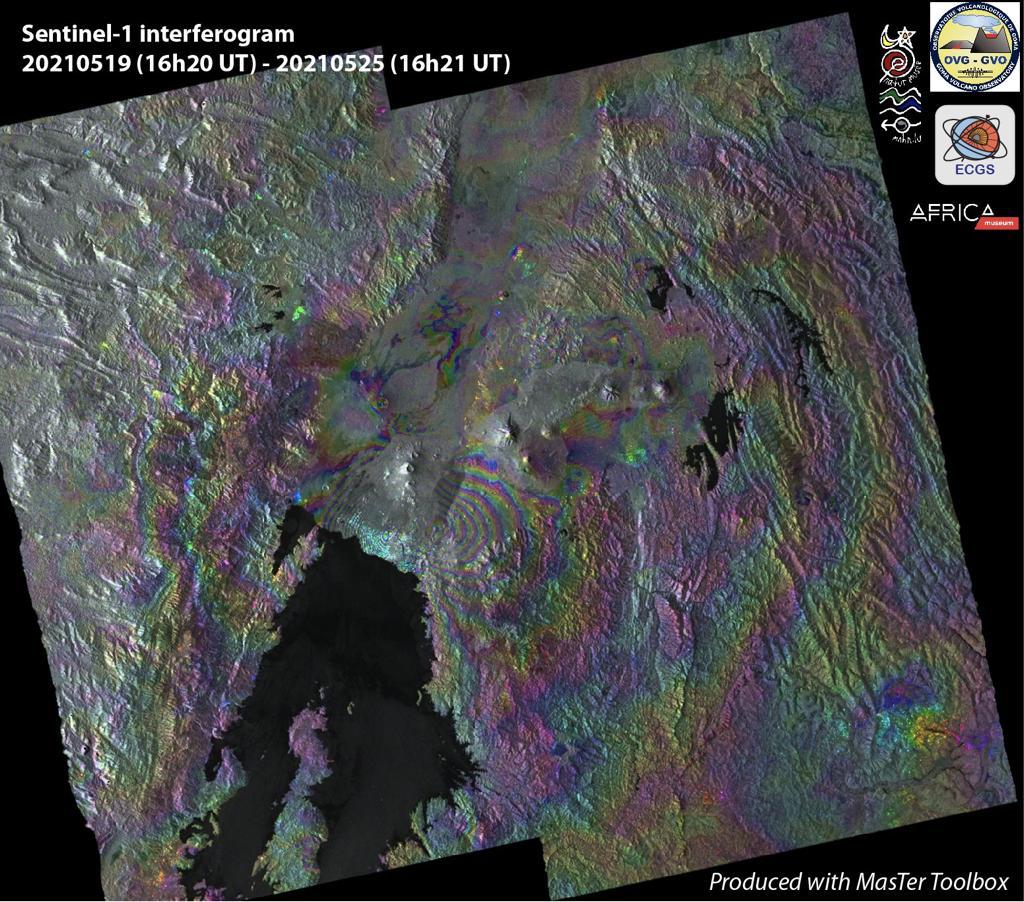
Figure 1: This interferogram has been computed with the MasTer Toolbox using two pairs of stitched Copernicus Sentinel-1 scenes acquired 6 days apart, respectively on May 19th and May 25th at 04:20pm UTC. Each fringe corresponds to 3 cm of ground displacement in the line of sight (LOS) of the satellite. Images were acquired along the ascending orbit number 174 with an incidence angle at median slant range of 37 degrees.
Preliminary estimation shows that the ground deformation under the city of Goma ranges from more than +40 cm to -30 cm in LOS. These values are probably exceeded where the fringes density is too high to measure the displacement. This and the several earthquakes affecting the area are responsible for important damages to the infrastructures. This ground deformation is caused by at least one new shallow dike (magma intrusion), the characteristics of which will soon be defined by modelling. Modelling the source of these deformations will help to assess the possible evolution of the crisis.
The magma intrusion is accompanied by an intense seismicity that has been ongoing since the beginning of the eruption on May 22th and that migrated southward since then.
Below: same interferogram without amplitude baground and without color dimming by coherence.
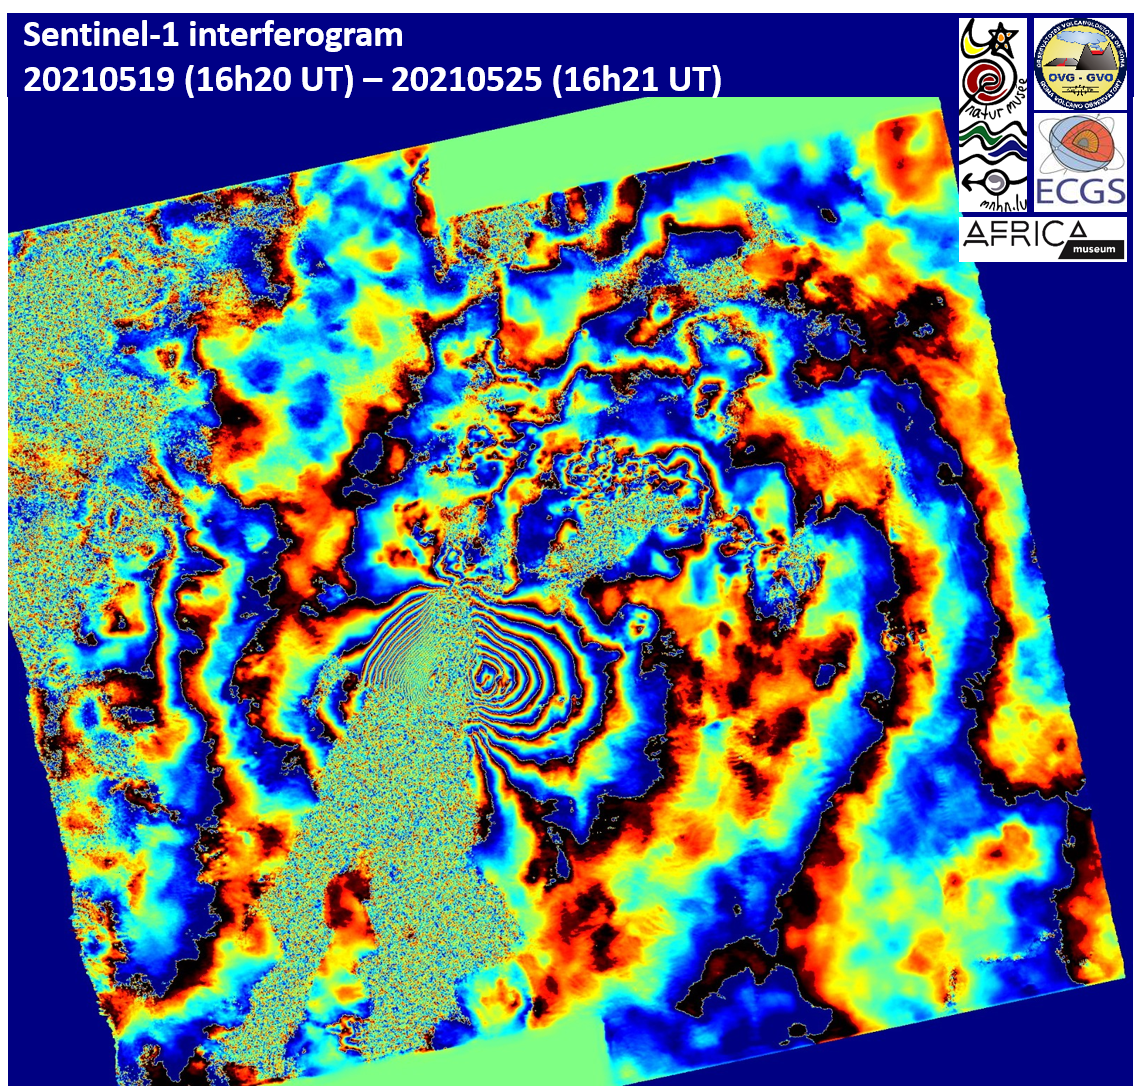
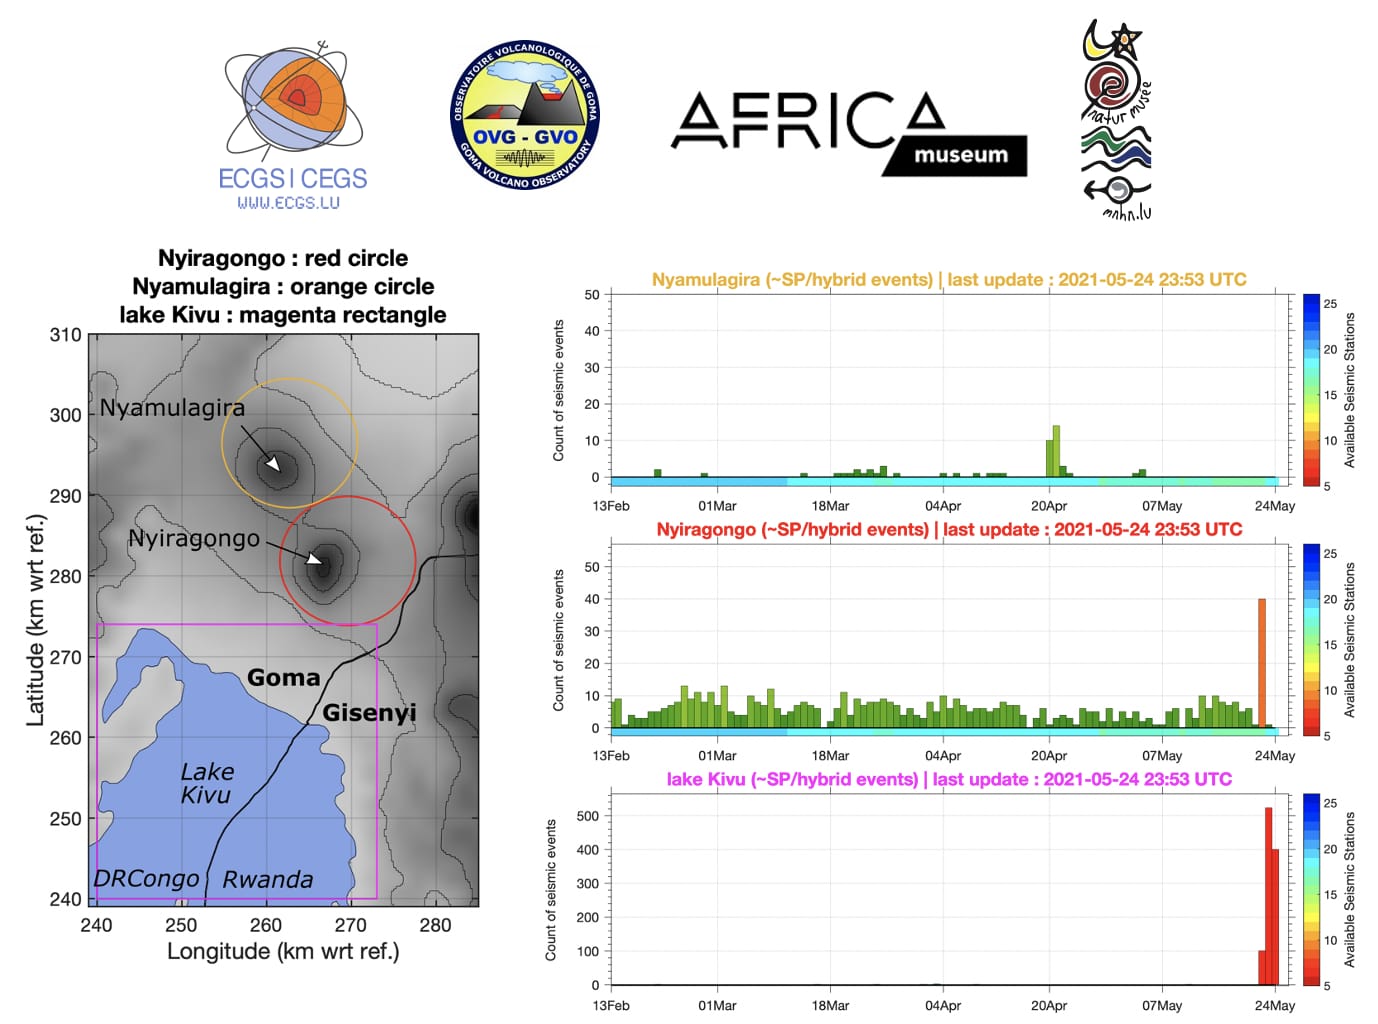
Figure 2: Left: Definition of zones for seismic event counts. The areas around the Nyamulagira and Nyiragongo volcanoes are indicated with yellow and red circles, respectively, and the magenta area includes Lake Kivu and the city of Goma. Right: Automatic daily counts of short-period (SP) and hybrid earthquakes in the three areas marked on the map during the last 101 days (from February 13). Each bar is a daily count. Apart from a swarm on April 20-21, 2021 at Nyamulagira composed mostly of long-period (LP) events (thus with very few earthquakes that could be qualified as hybrid), no abnormal hybrid or short-period earthquake activity occurred before the start of the Nyiragongo eruption on May 22, 2021 around 16:15 UTC.
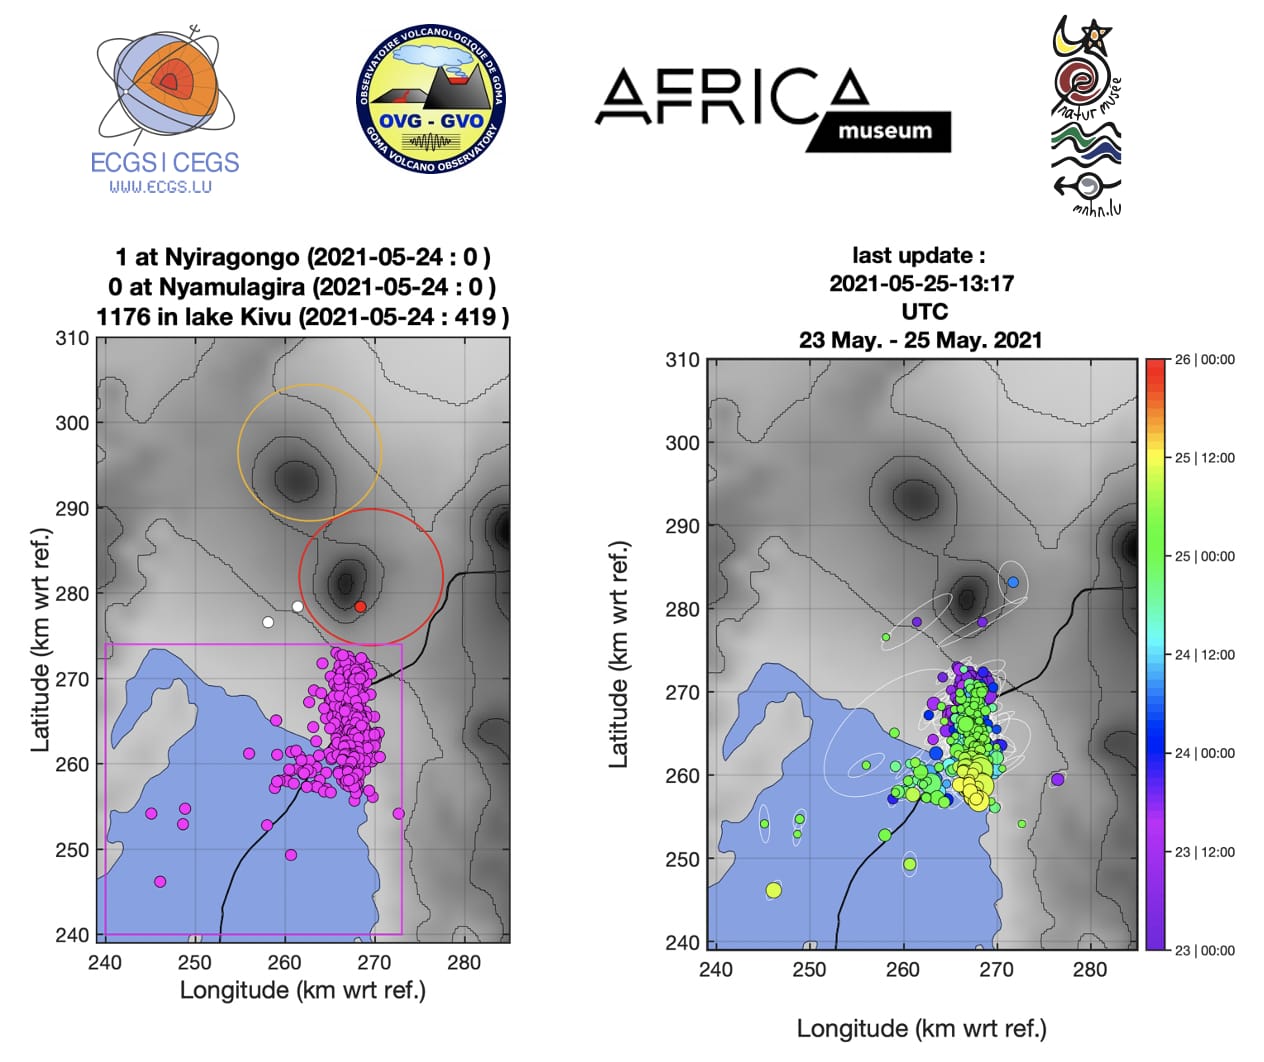
Figure 3: a) Zones for counting seismic events and earthquakes automatically located on 23, 24 and 25 May 2021 (last updated on 25 May at 13:17 UTC); b) Another representation of the automatic earthquake location map on 23, 24 and 25 May (last updated on 25 May at 13:17 UTC) where the colour scale corresponds to the time of origin of each event. The progression of seismicity from the first eruptive fissure at the foot of Nyiragongo to the south of Goma (DRC) / Gisenyi (Rwanda) is clearly visible.
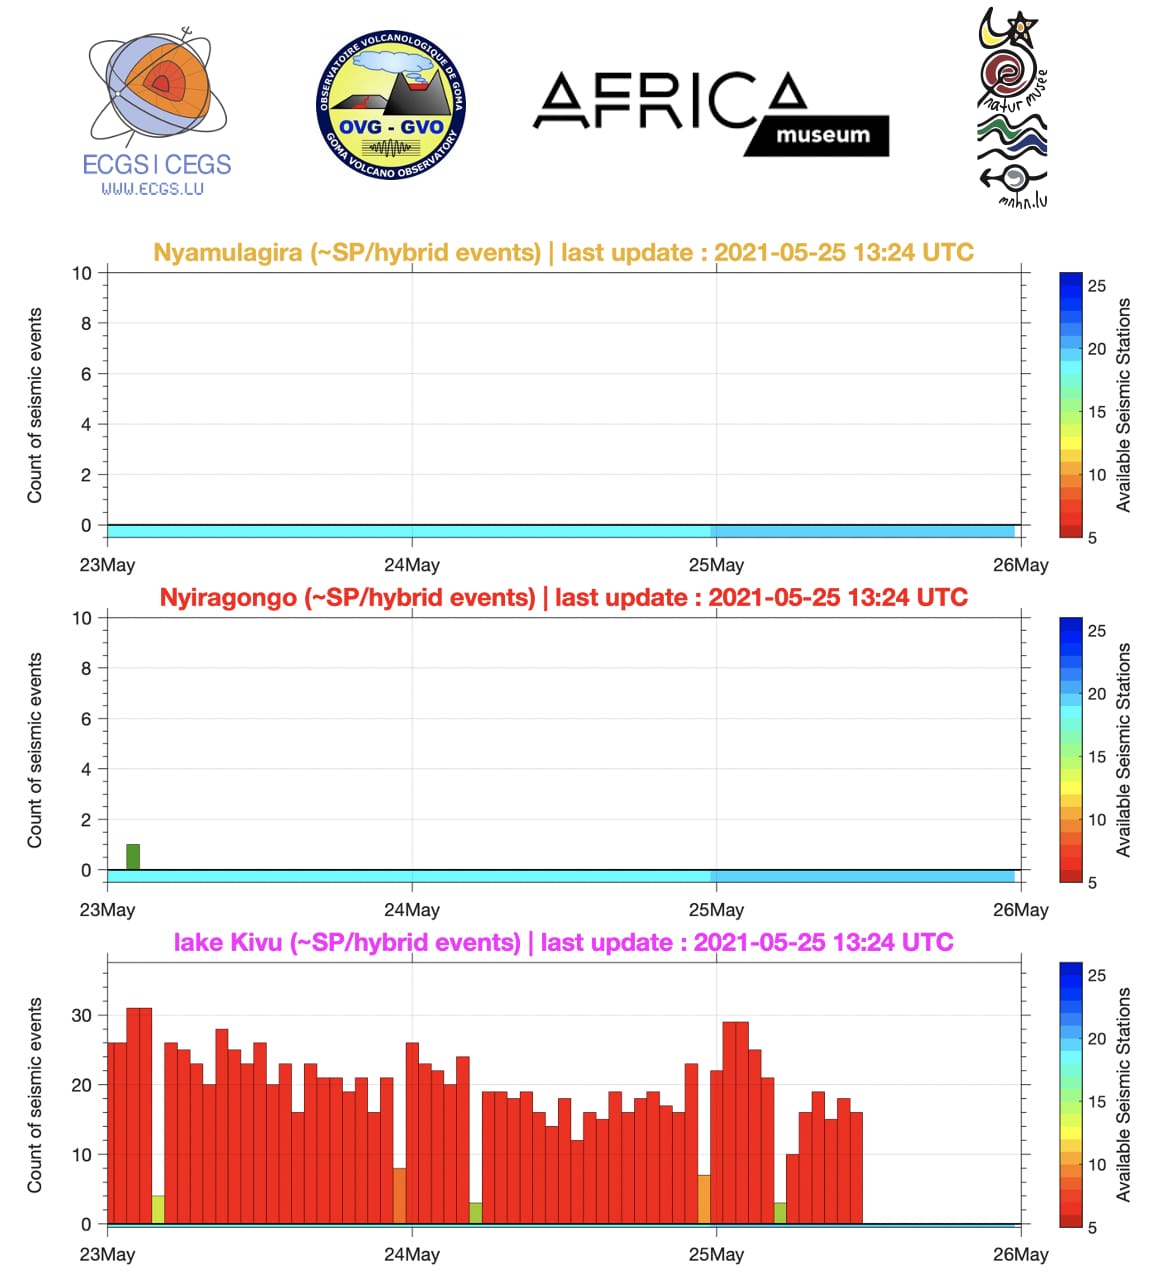
Figure 4: Automatic hourly counts of short-period (SP) and hybrid earthquakes in the three areas marked on the map during the last 3 days (from midnight 22 May; last updated on 25 May at 13:24 UTC), whose locations are shown in Figure 3 a) and b). Each bar is an hourly count.
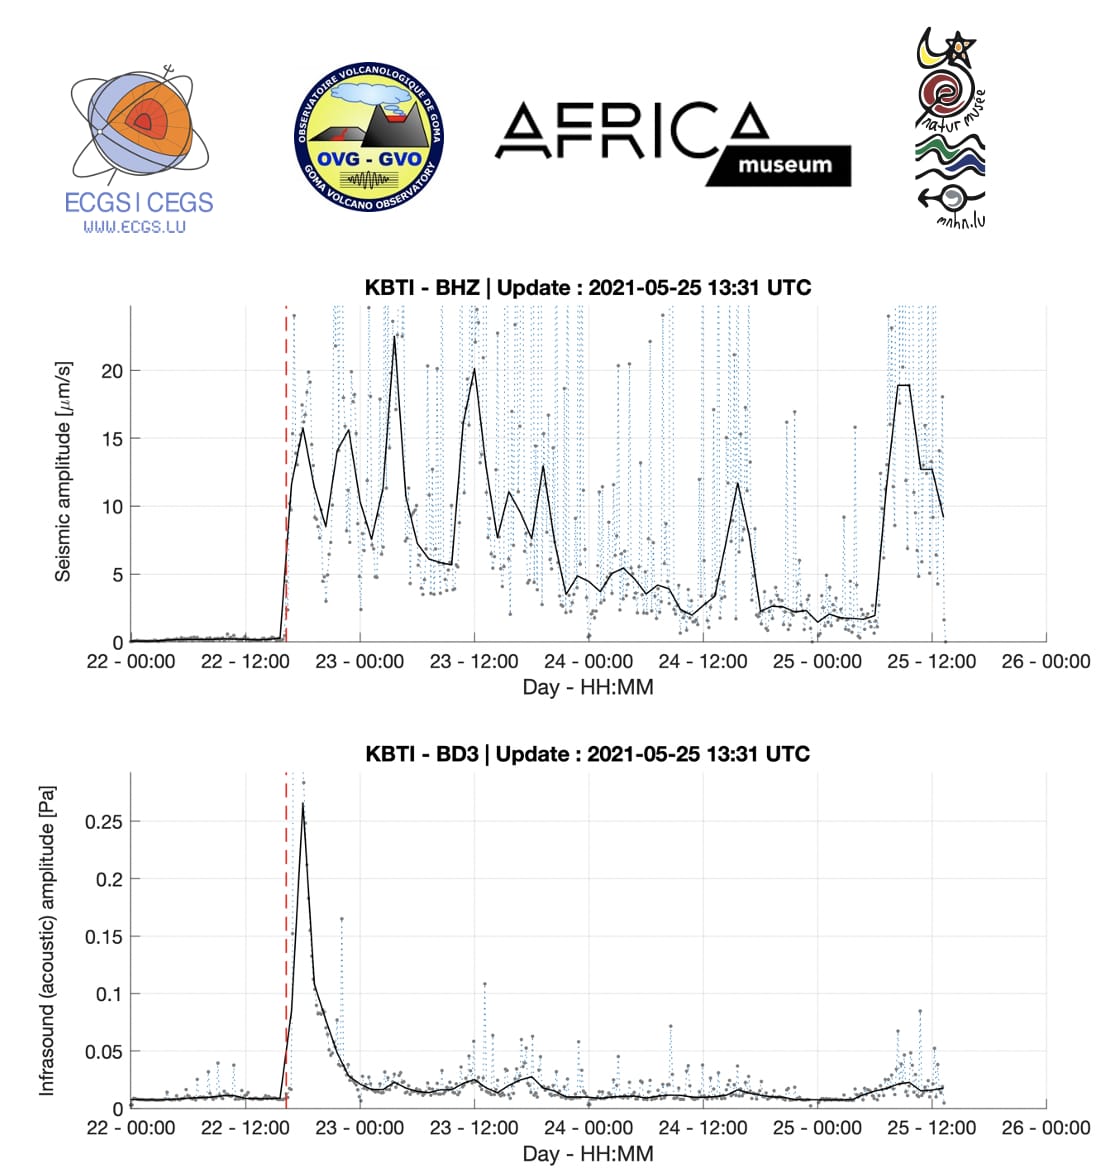
Figure 5: Seismic and Infrasound (Acoustic) amplitude measurements since 21 May 2021 (10-minute windows + moving average, filtered between 2-10 Hz) at Kibati station, about 6 km away from Nyiragongo's summit on its eastern flank.
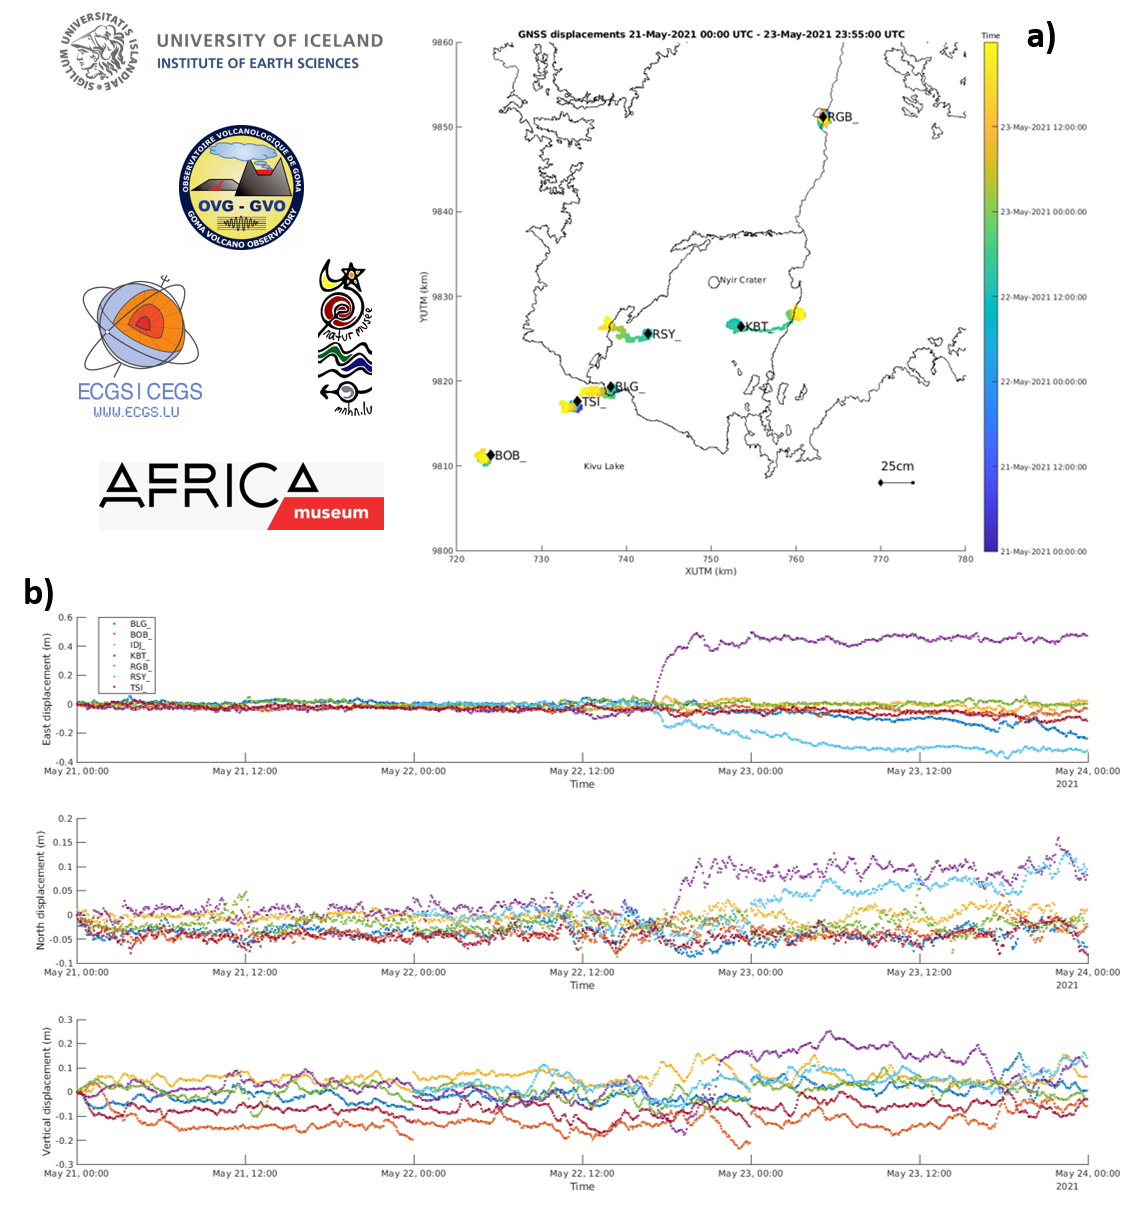
Figure 6: a) Map showing the horizontal displacements recorded by the GNSS stations of the KivuGNet network. Processing epoch by epoch, 1 point every 5 minutes between 21-05-2021 00:00 and 23-05-2021 23:55. The black contours mark the historical lava fields of Nyiragongo and Nyamulagira. b) Time series of east-west, north-south and vertical displacements for the 6 stations shown on the map above. Data processing by H. Geirsson (univ. Iceland).
![]()