2021-05-27 Follow up of the Nyiragongo eruption
Current seismicity and ground deformation data continue to indicate the presence of magma under the Goma urban area with extension under Lake Kivu.
Seismicity remains high and continues to migrate southwards and surface deformation is still recorded by the GPS network. These observations are consistent with the continued propagation of magma at depth towards the south. InSAR data also show that deformation is continuing; the image acquired this morning shows the progression (see figures 5 and 6).
Comparison of satellite radar images acquired on 23, 24, 25 and 26 May indicates that the crater inside the summit of Nyiragongo continues to widen after the partial drainage of the lava lake. Ash fallout may occur as a result of the collapse of parts of the crater interior.
Data on the stability of Lake Kivu currently show no significant change.
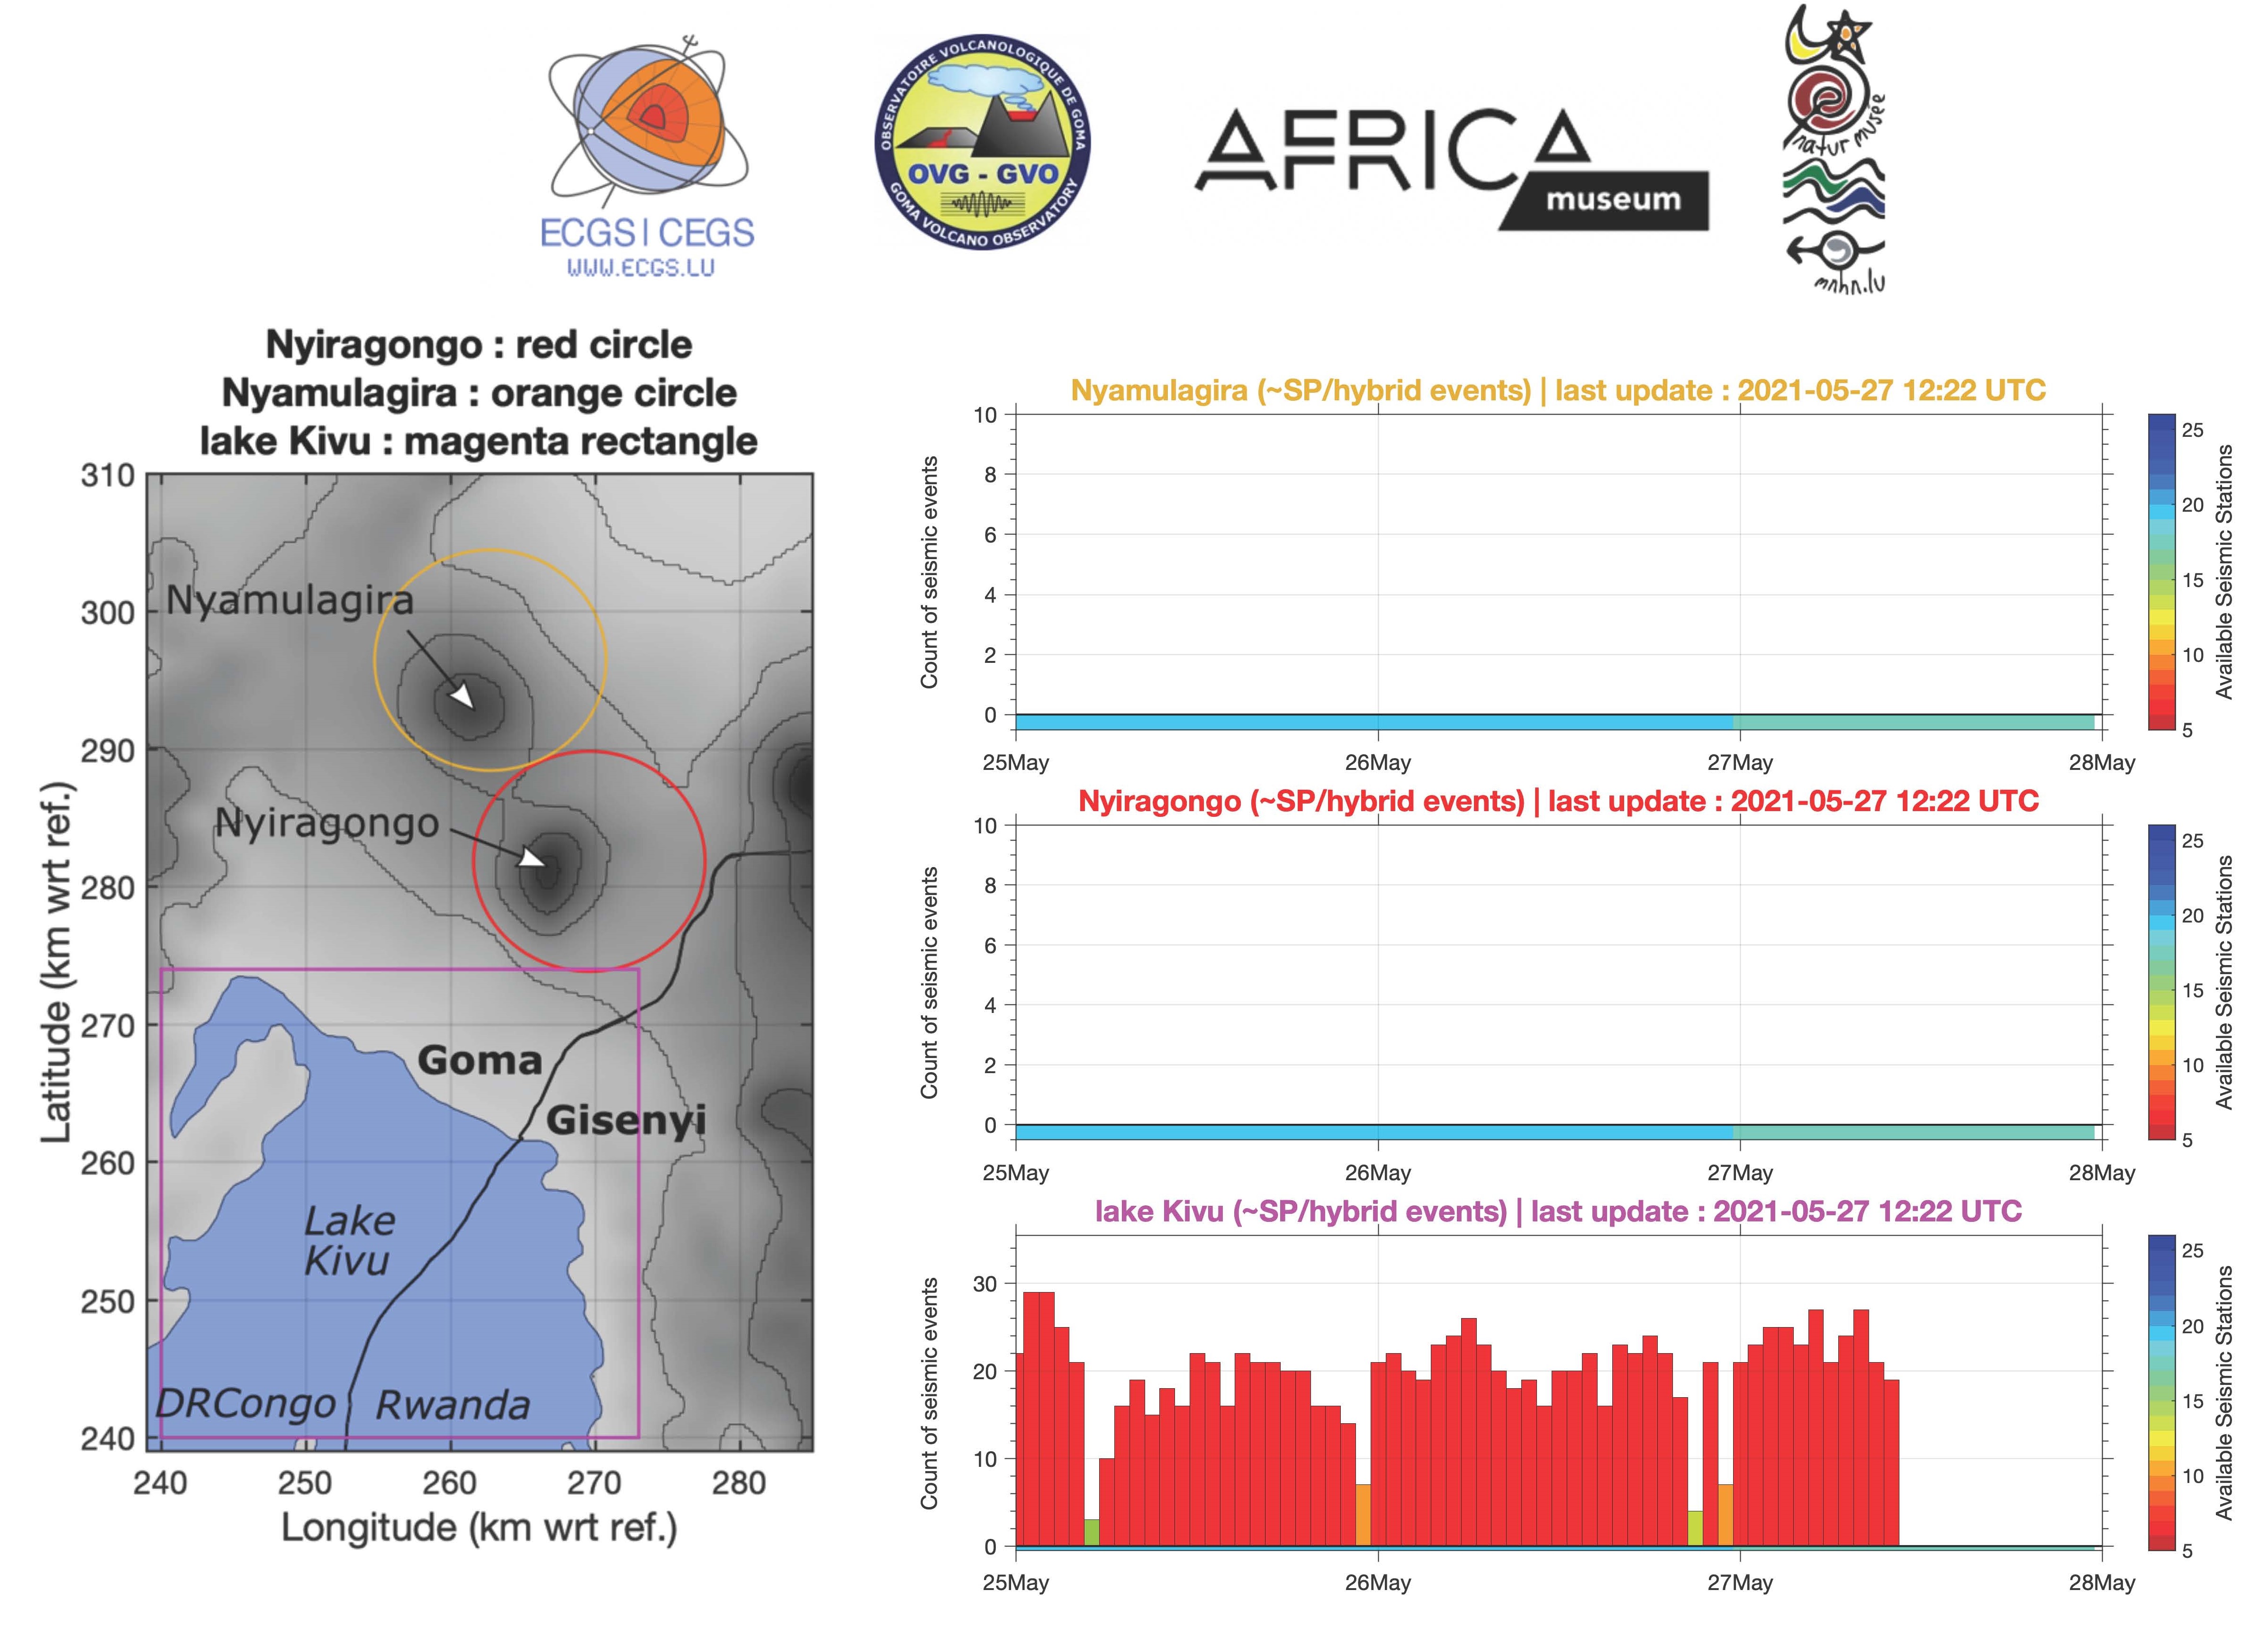
Figure 1: left) Zones for counting seismic events and right) automatic hourly counts of short-period (SP) and hybrid earthquakes in the three areas marked on the map during the last 3 days (from midnight 25 May; last updated on 27 May at 12:22 UTC). Each bar is an hourly count.
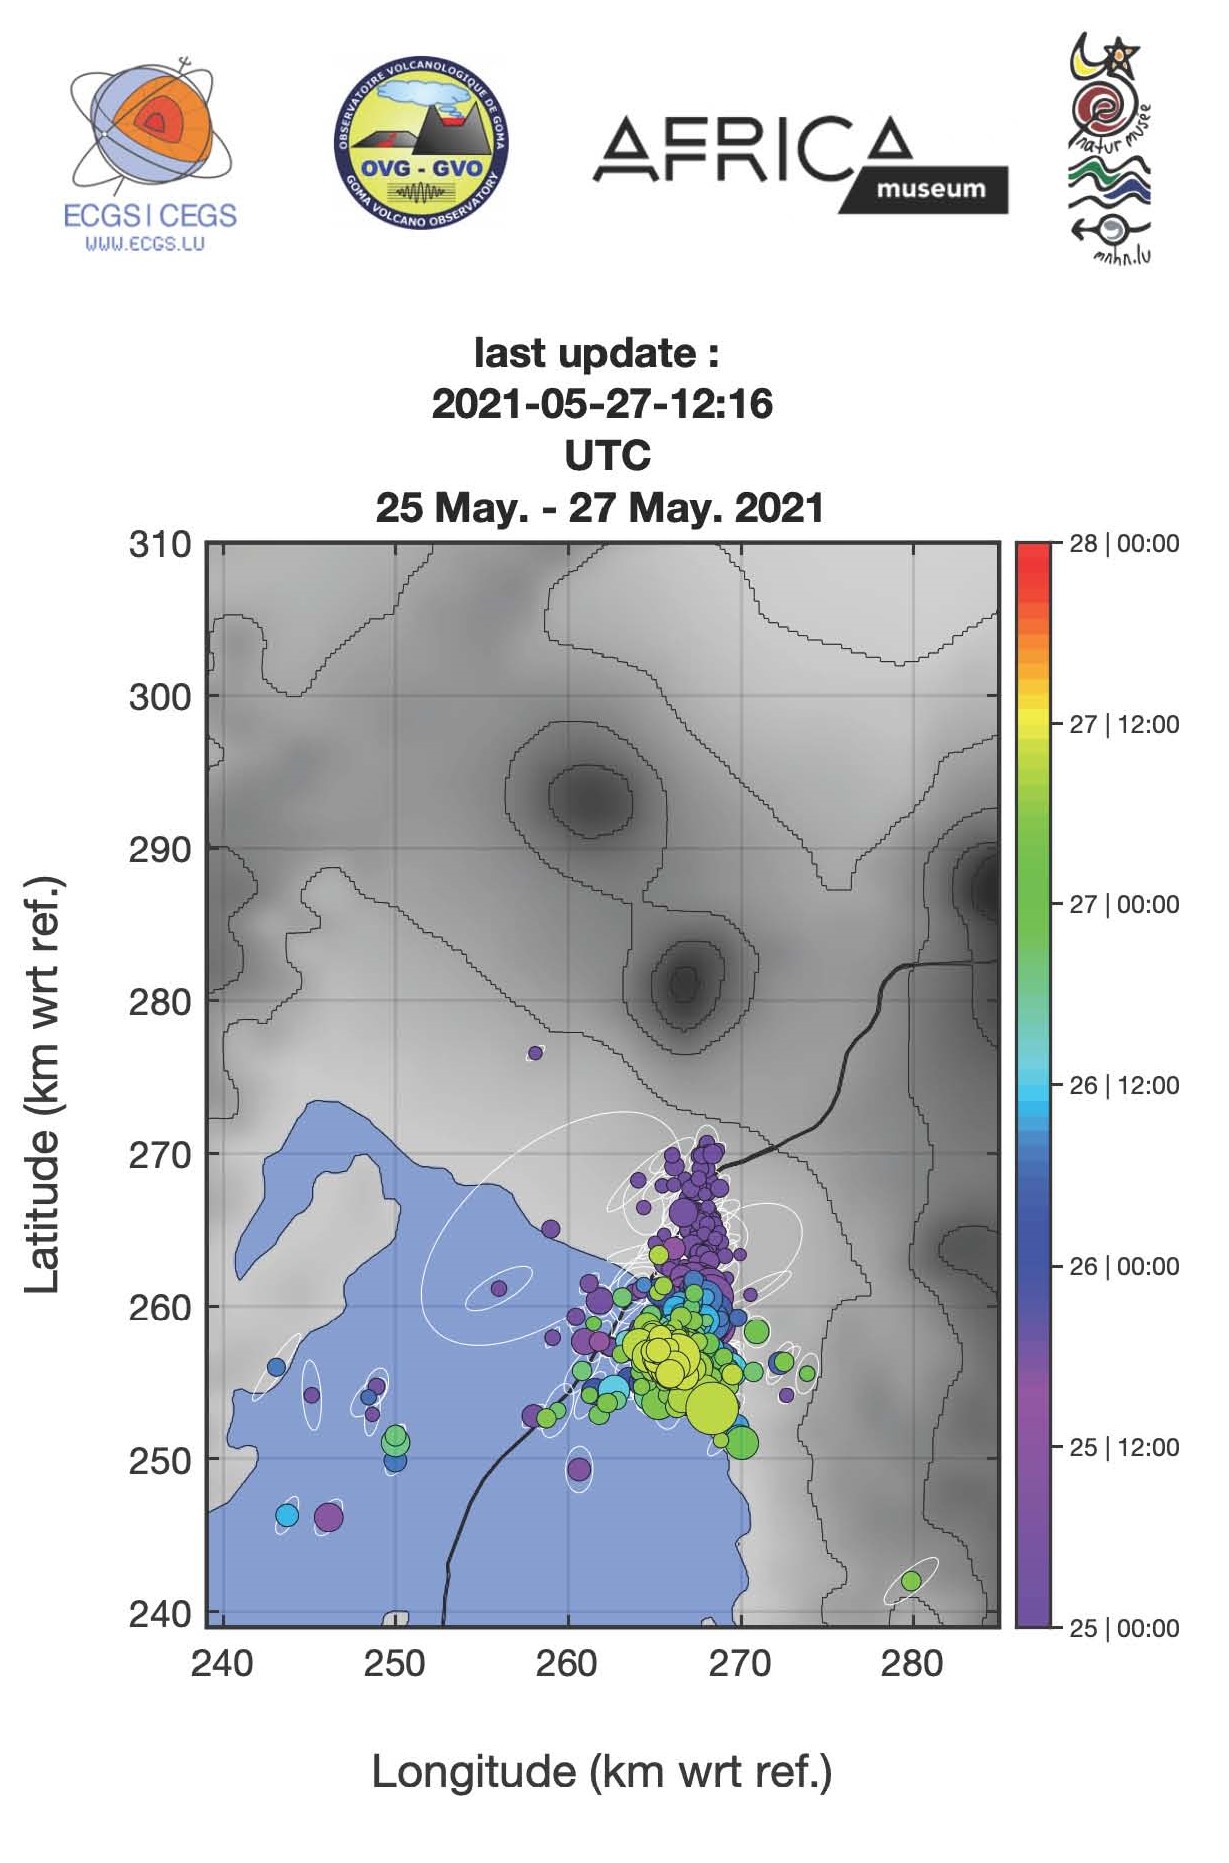
Figure 2: Earthquakes automatically located on 25, 26 and 27 May 2021 (last updated on 27 May at 12:16 UTC) where the colour scale corresponds to the time of origin of each event (the marker size corresponds to the magnitude, see Figure 3)
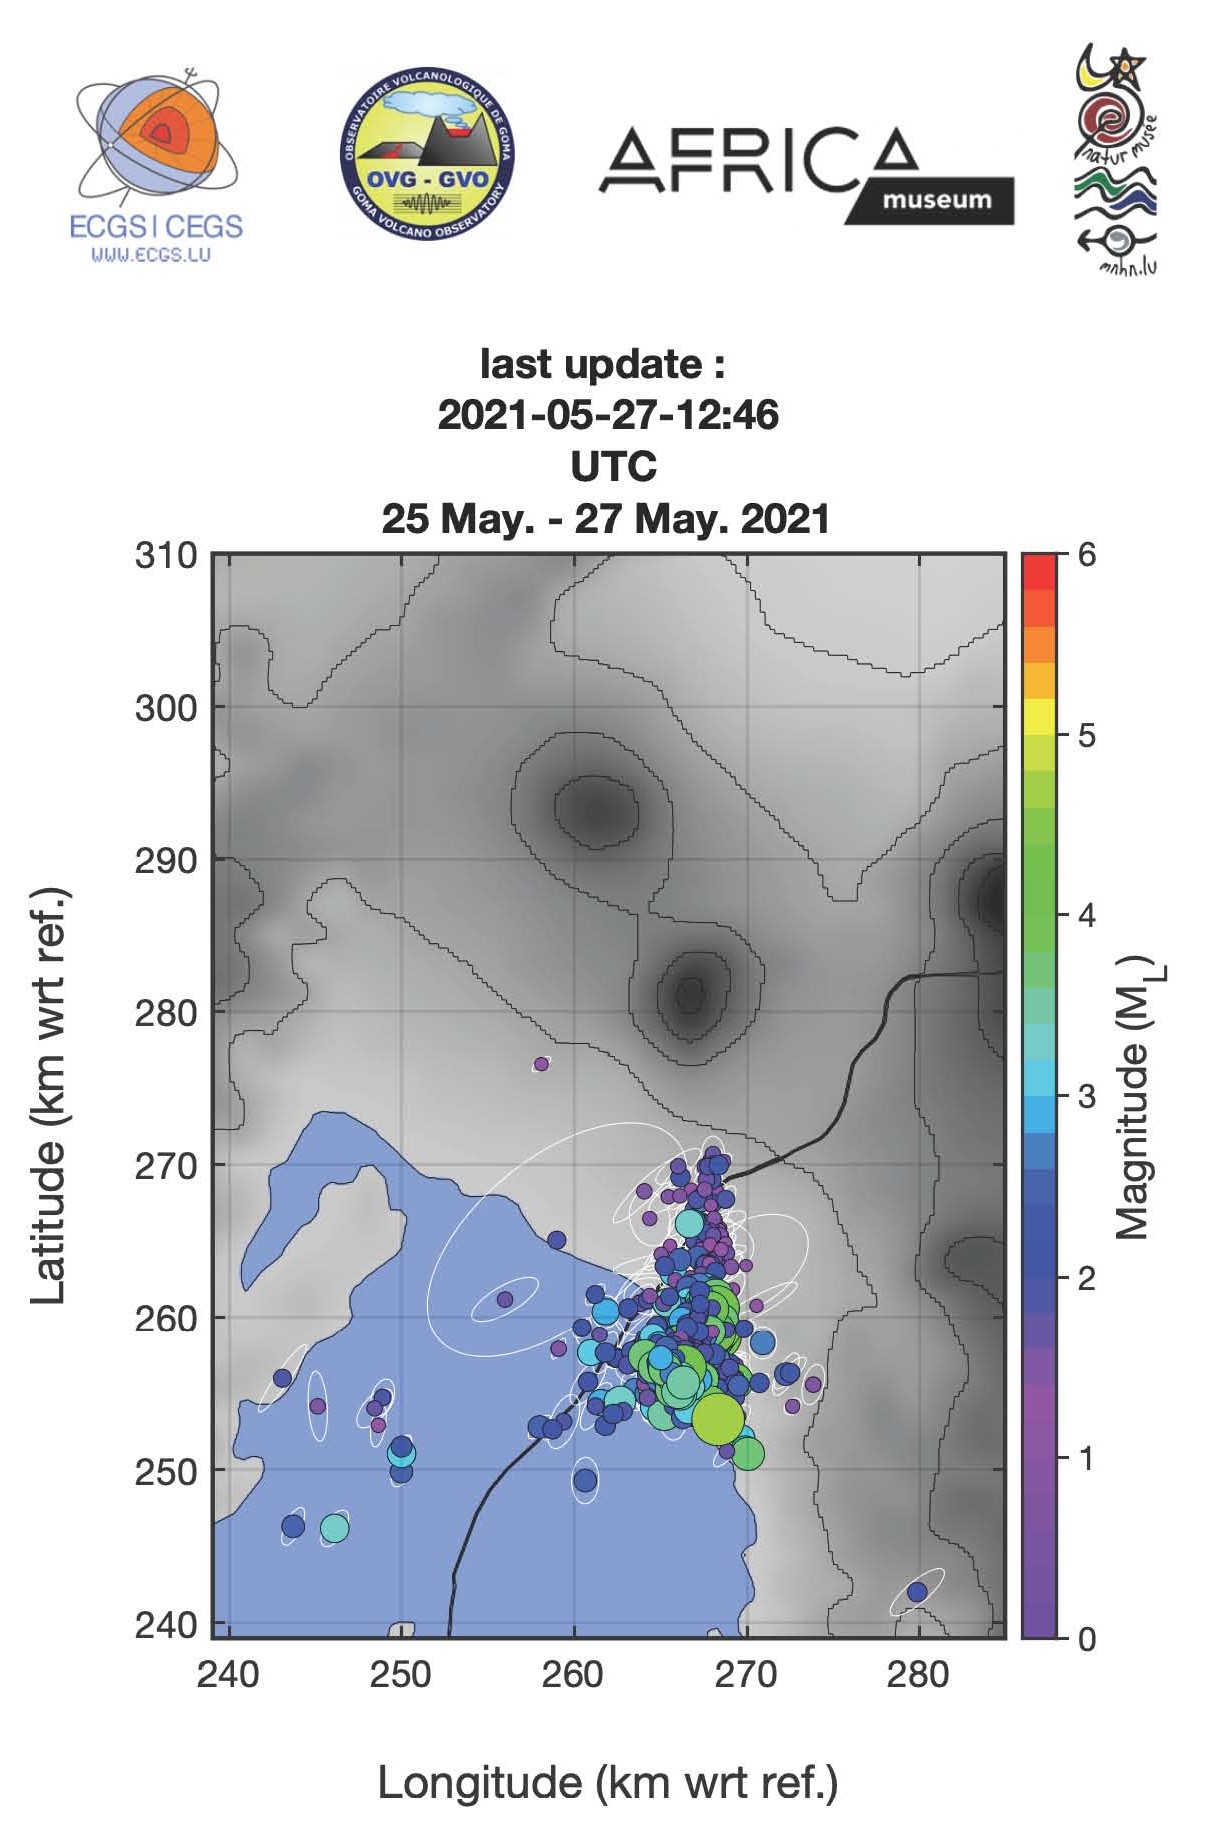
Figure 3: Earthquakes automatically located on 25, 26 and 27 May 2021 (last updated on 27 May at 12:46 UTC) where the colour scale and the larker size corresponds to the magnitude of each event.
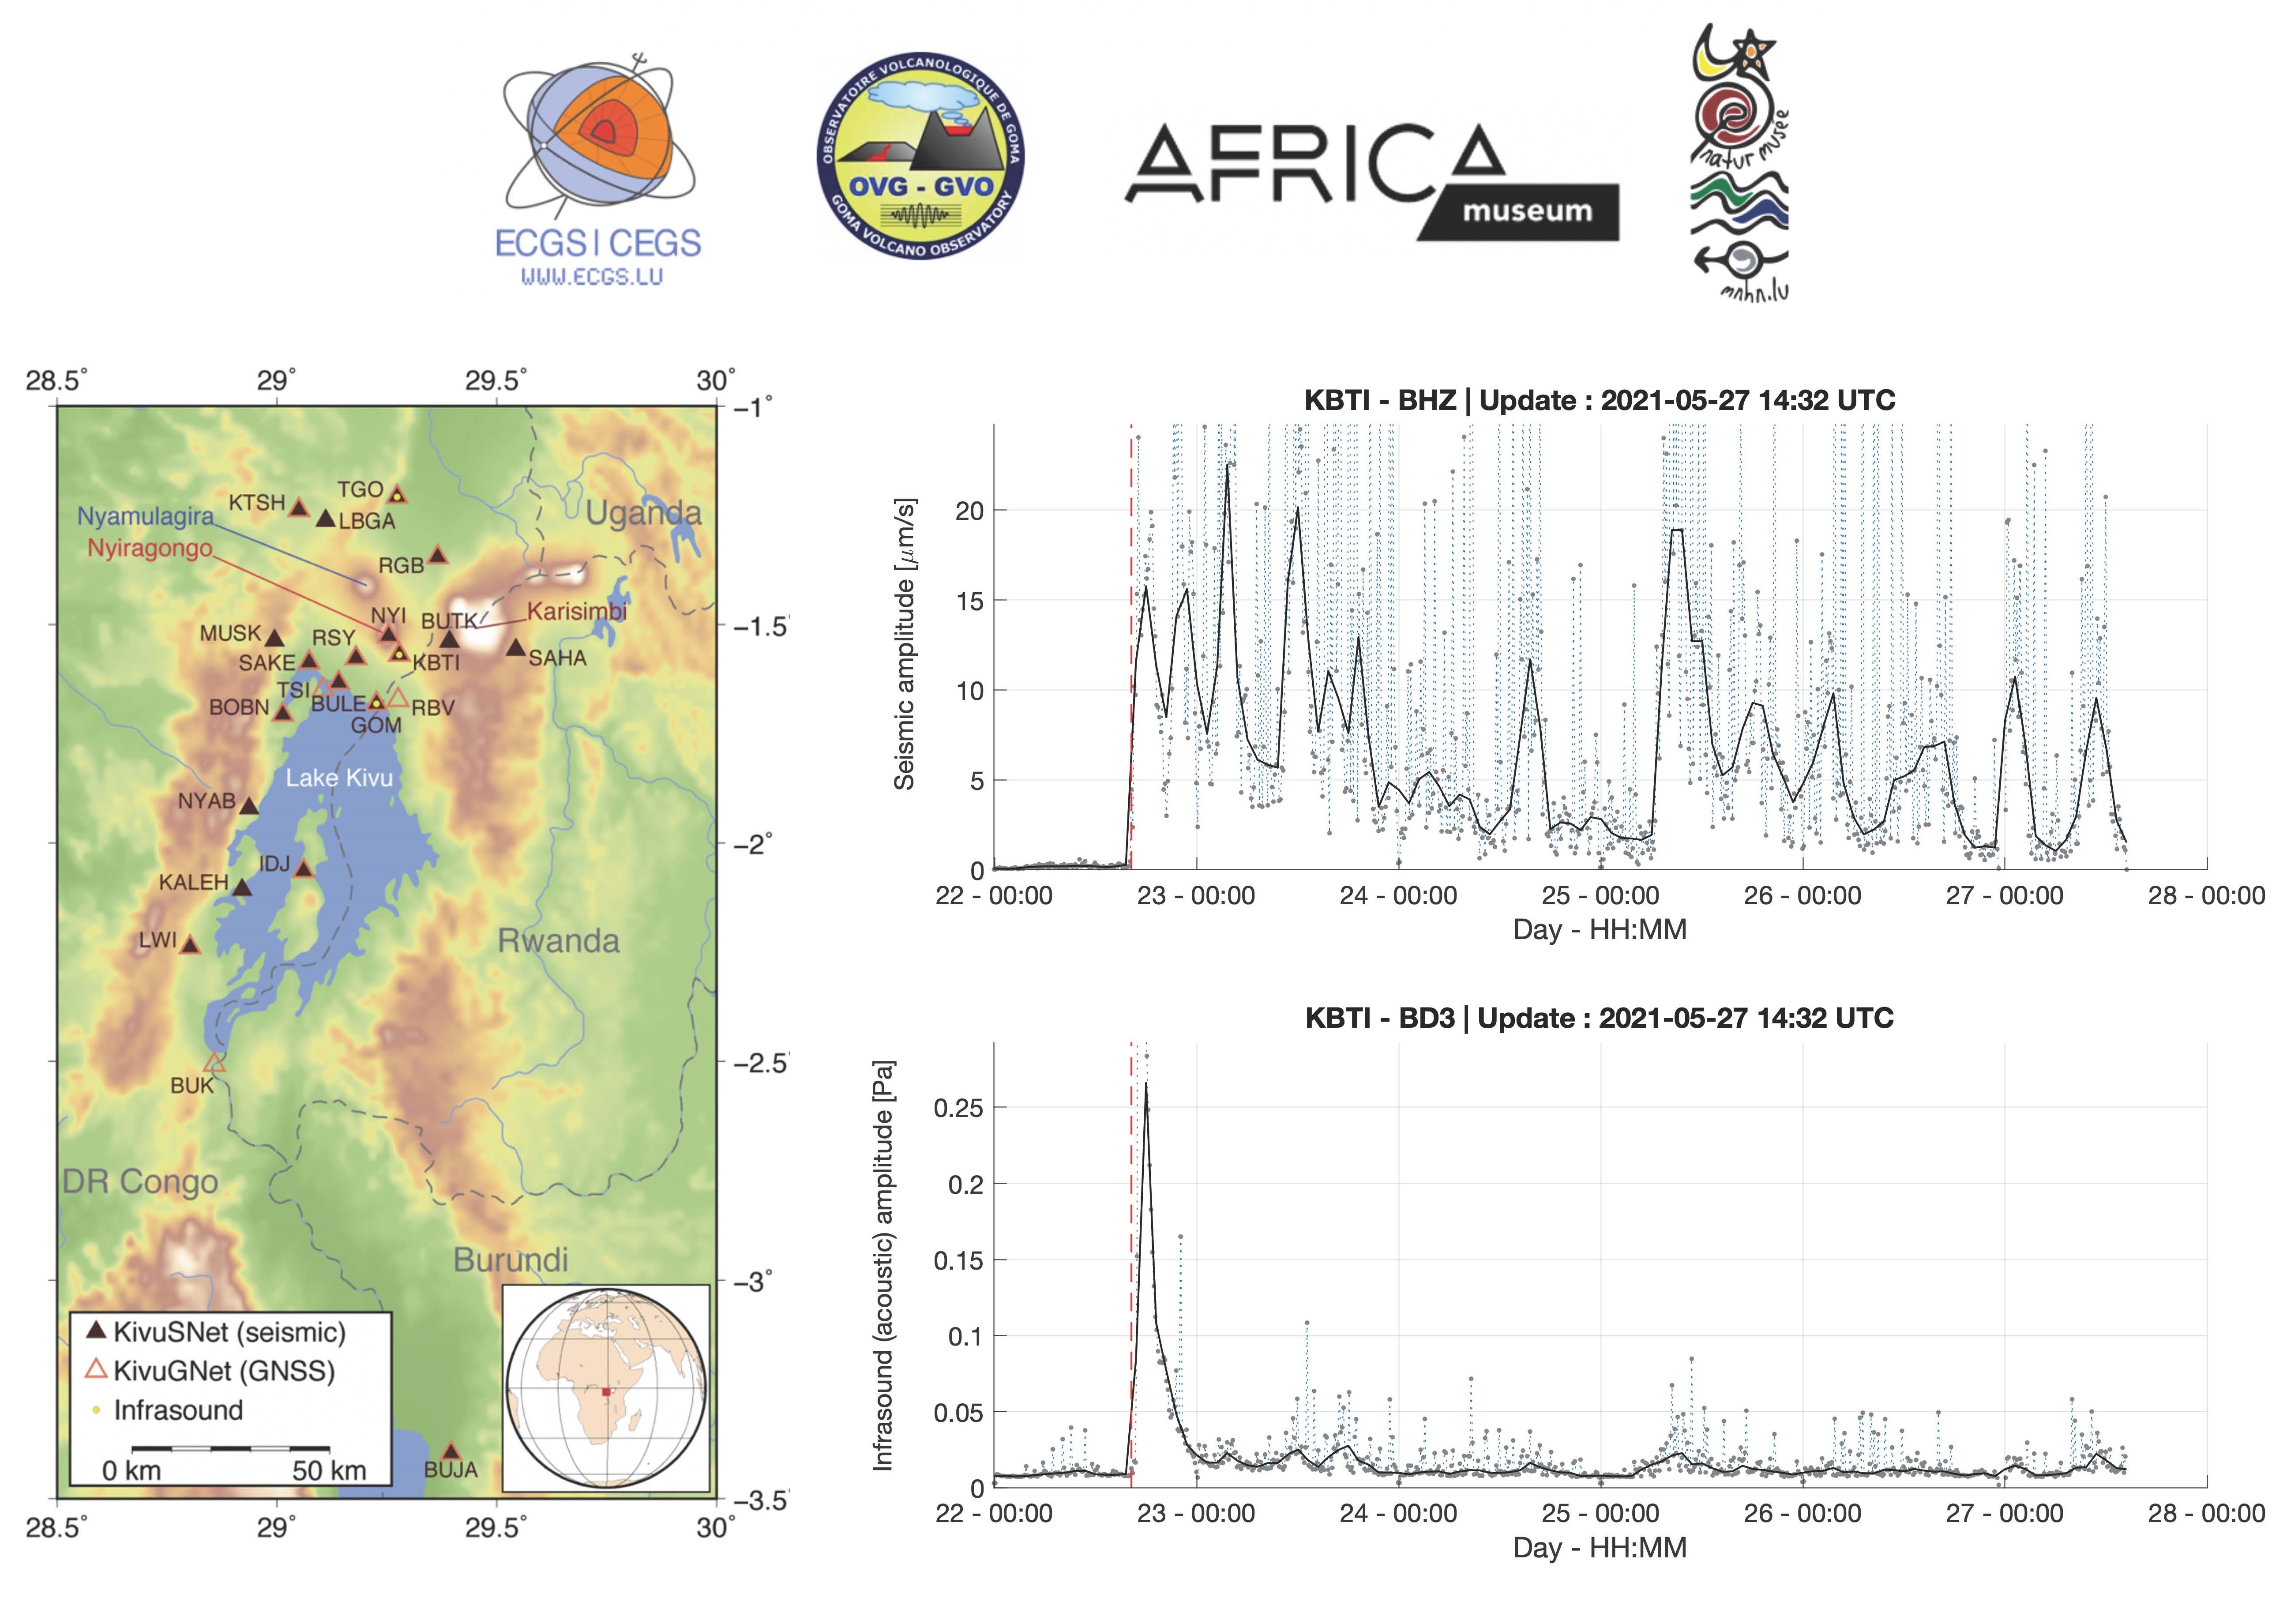
Figure 4: left) Map of KivuSNet stations used for earthquake location maps (see Figures 2 and 3) and right) Seismic and Infrasound (Acoustic) amplitude measurements since 21 May 2021 (10-minute windows + moving average, filtered between 2-10 Hz) at Kibati station (KBTI), about 6 km away from Nyiragongo's summit on its eastern flank.
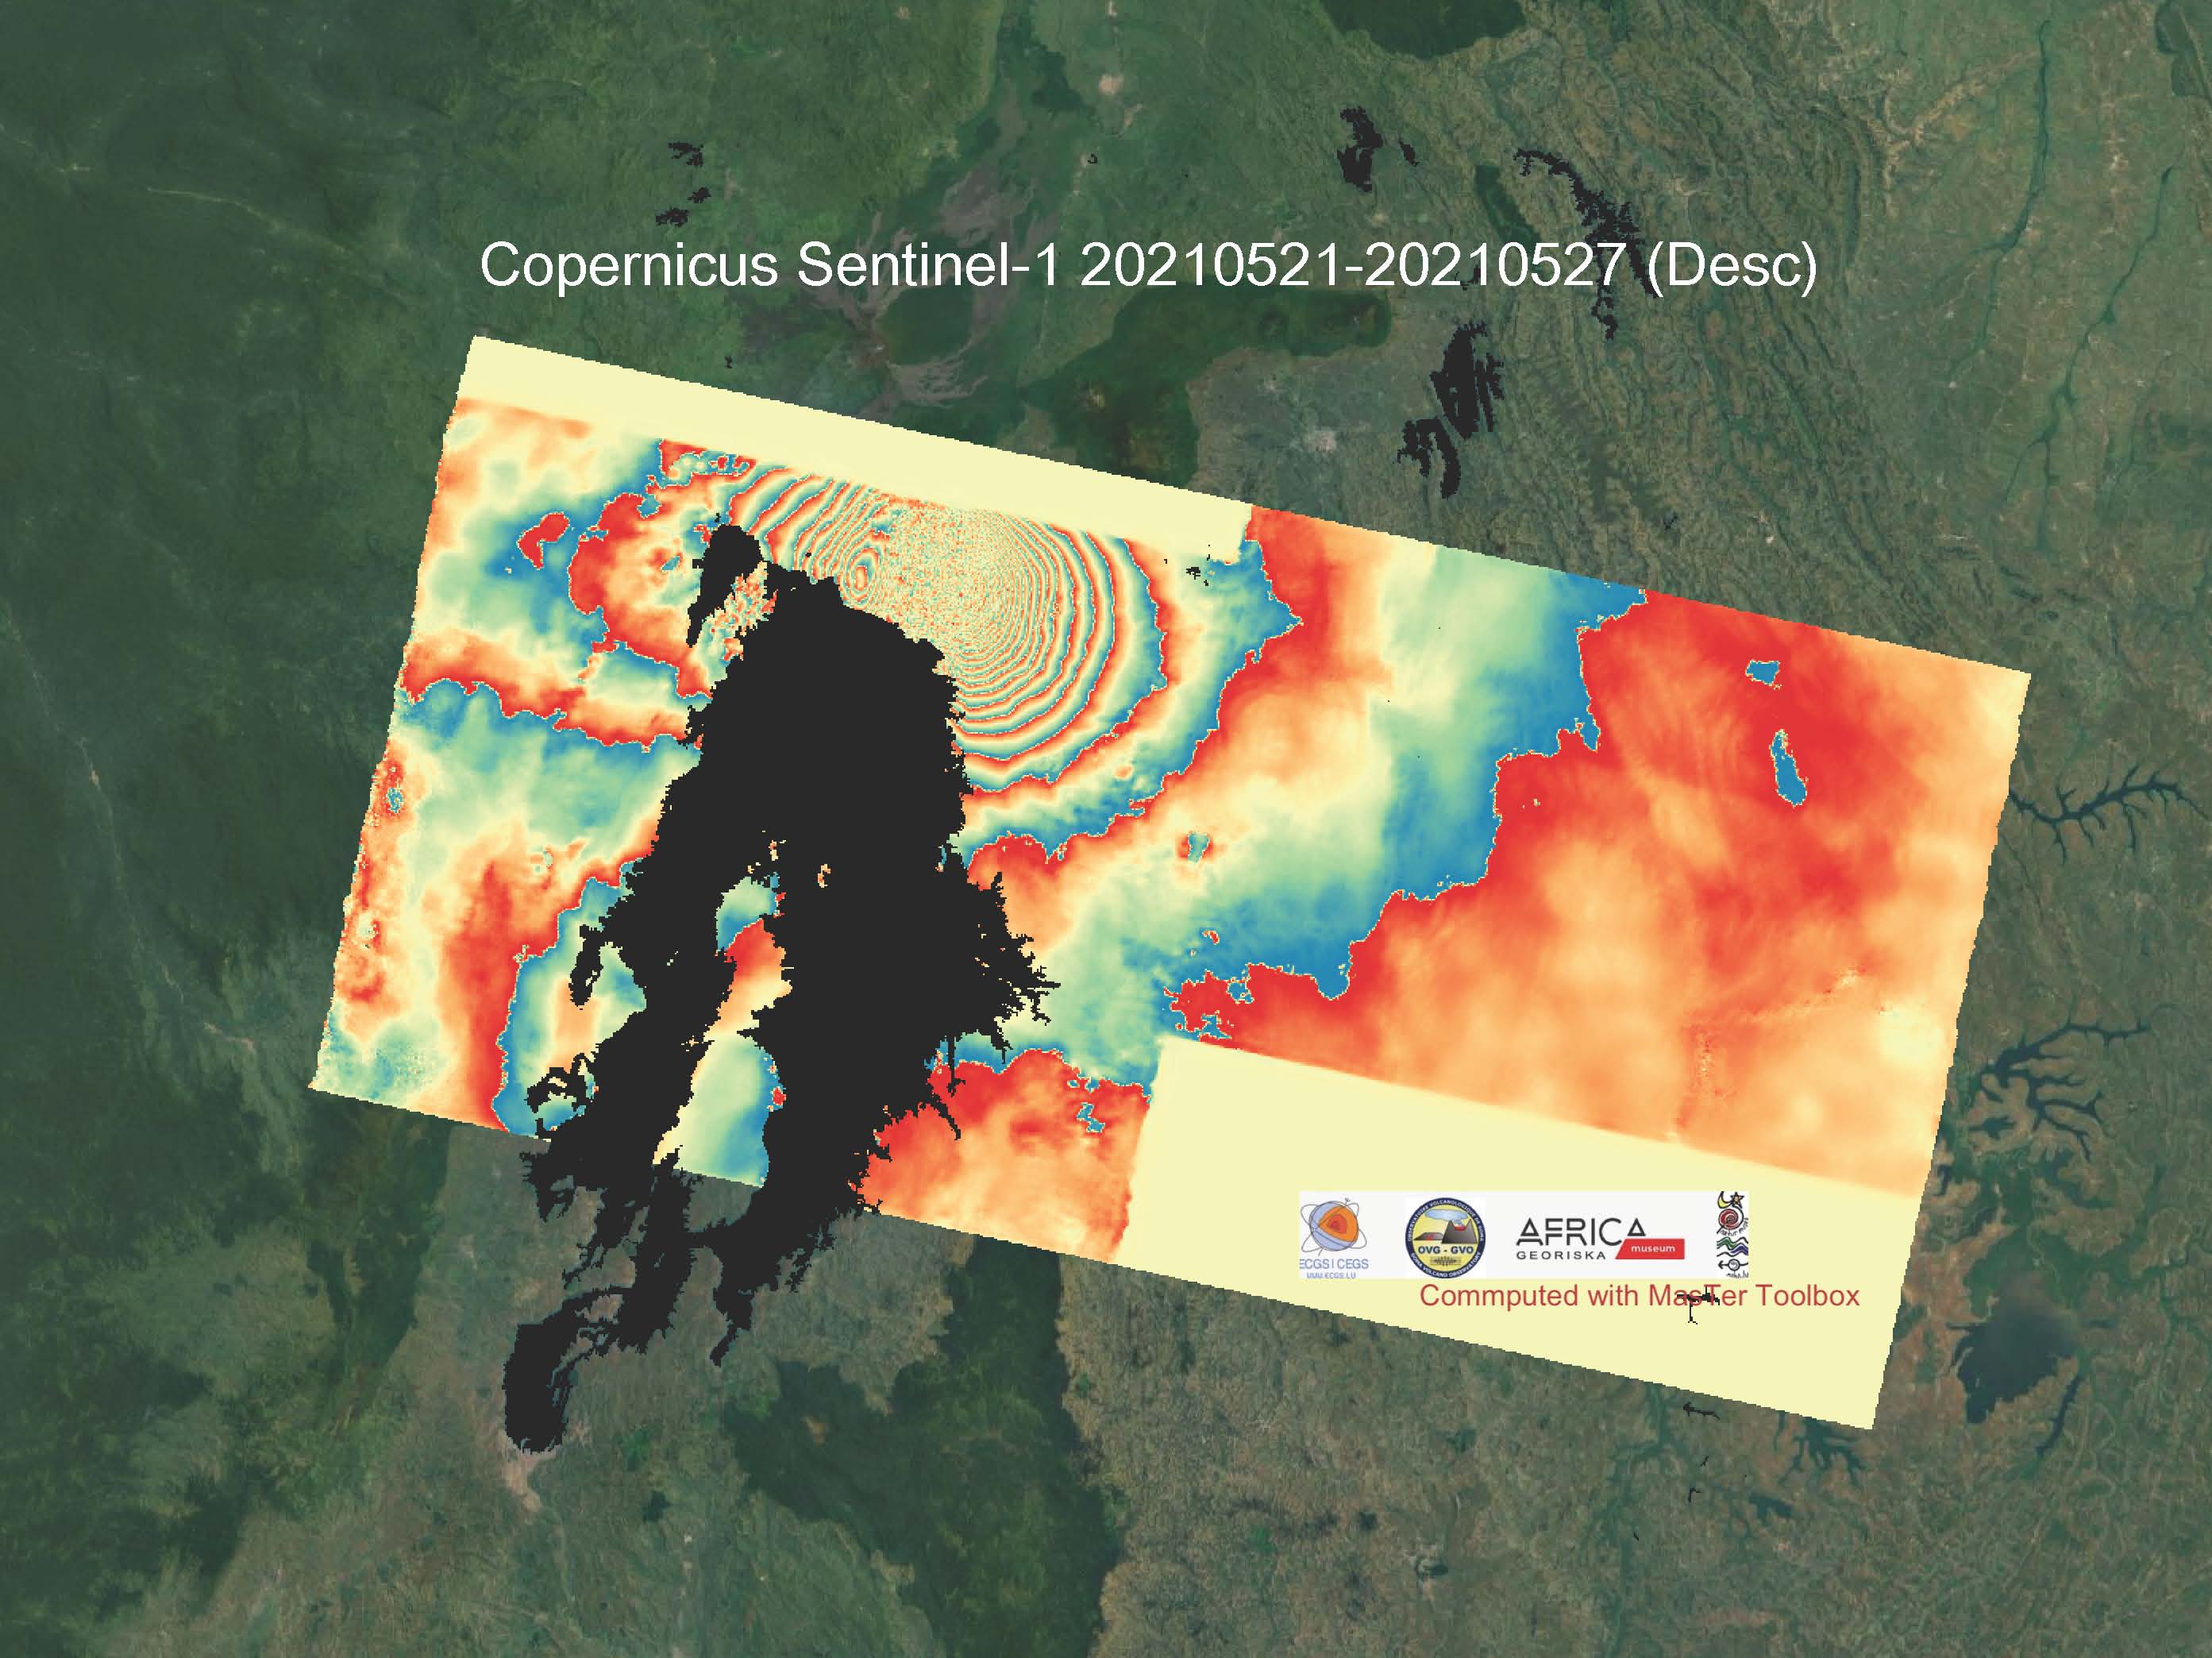
Figure 5: This interferogram has been computed with the MasTer Toolbox using two Copernicus Sentinel-1 scenes acquired 6 days apart, respectively on May 21th and May 27th at 02:40am UTC. Unfortunately the Northern scene covering the Nyiragongo volcano was not acquiered by the satellite.
Each fringe corresponds to 3 cm of ground displacement in the line of sight (LOS) of the satellite. Images were acquired along the descending orbit number 21 with an incidence angle at median slant range of 37 degrees.
This image shoes that the ground deformation has progressed toward the South compared to the last satelite acquisition on May 25.
This ground deformation is caused by at least one new shallow dike (magma intrusion), the characteristics of which will soon be defined by modelling. Modelling the source of these deformations will help to assess the possible evolution of the crisis. The pregression of the magma intrusion remains accompanied by an intense seismicity.
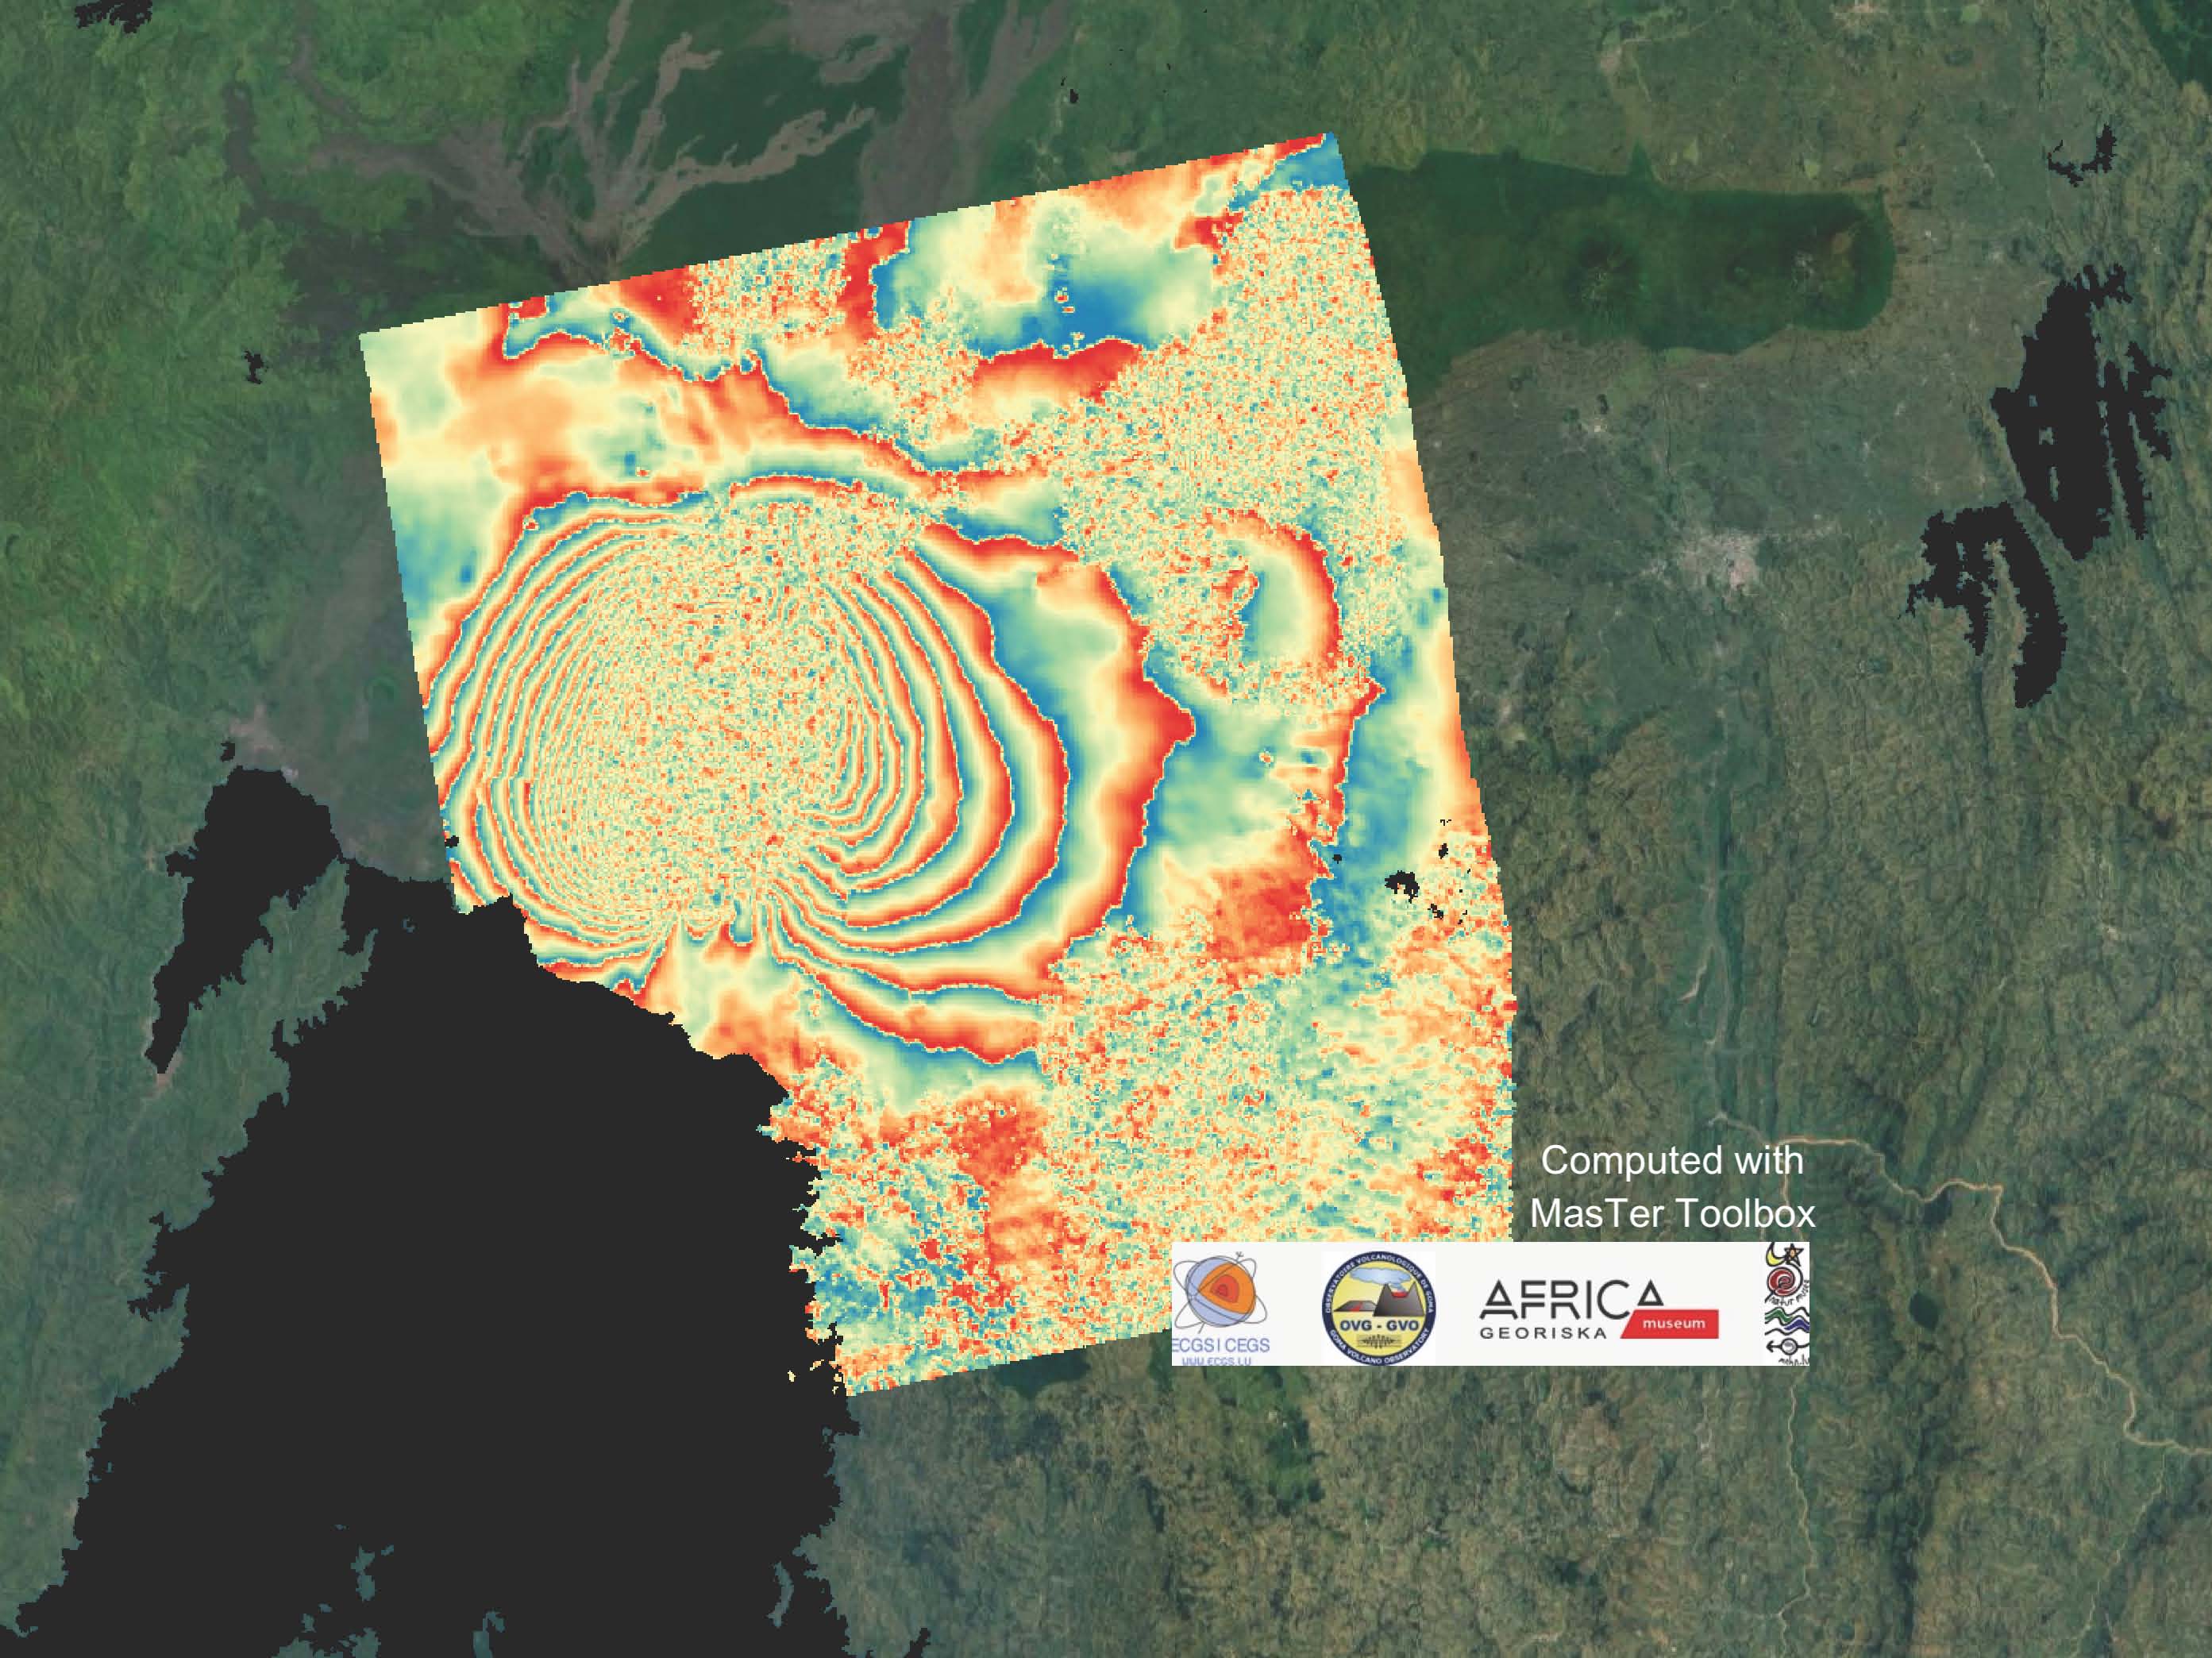
Figure 6: This interferogram has been computed with the MasTer Toolbox using two CosmoSkyMed scenes acquired 7 days apart, respectively on May 16th and May 23th at 04:03am UTC.
Each fringe corresponds to 1.5 cm of ground displacement in the line of sight (LOS) of the satellite. Images were acquired along the ascending orbit with an incidence angle at median slant range of 35 degrees.
This image shoes the beginning of the deformation accumulated during the first 12h of the crisis.
CSK images are provided by GEO-GSNL, Virunga Supersite, and ASI.
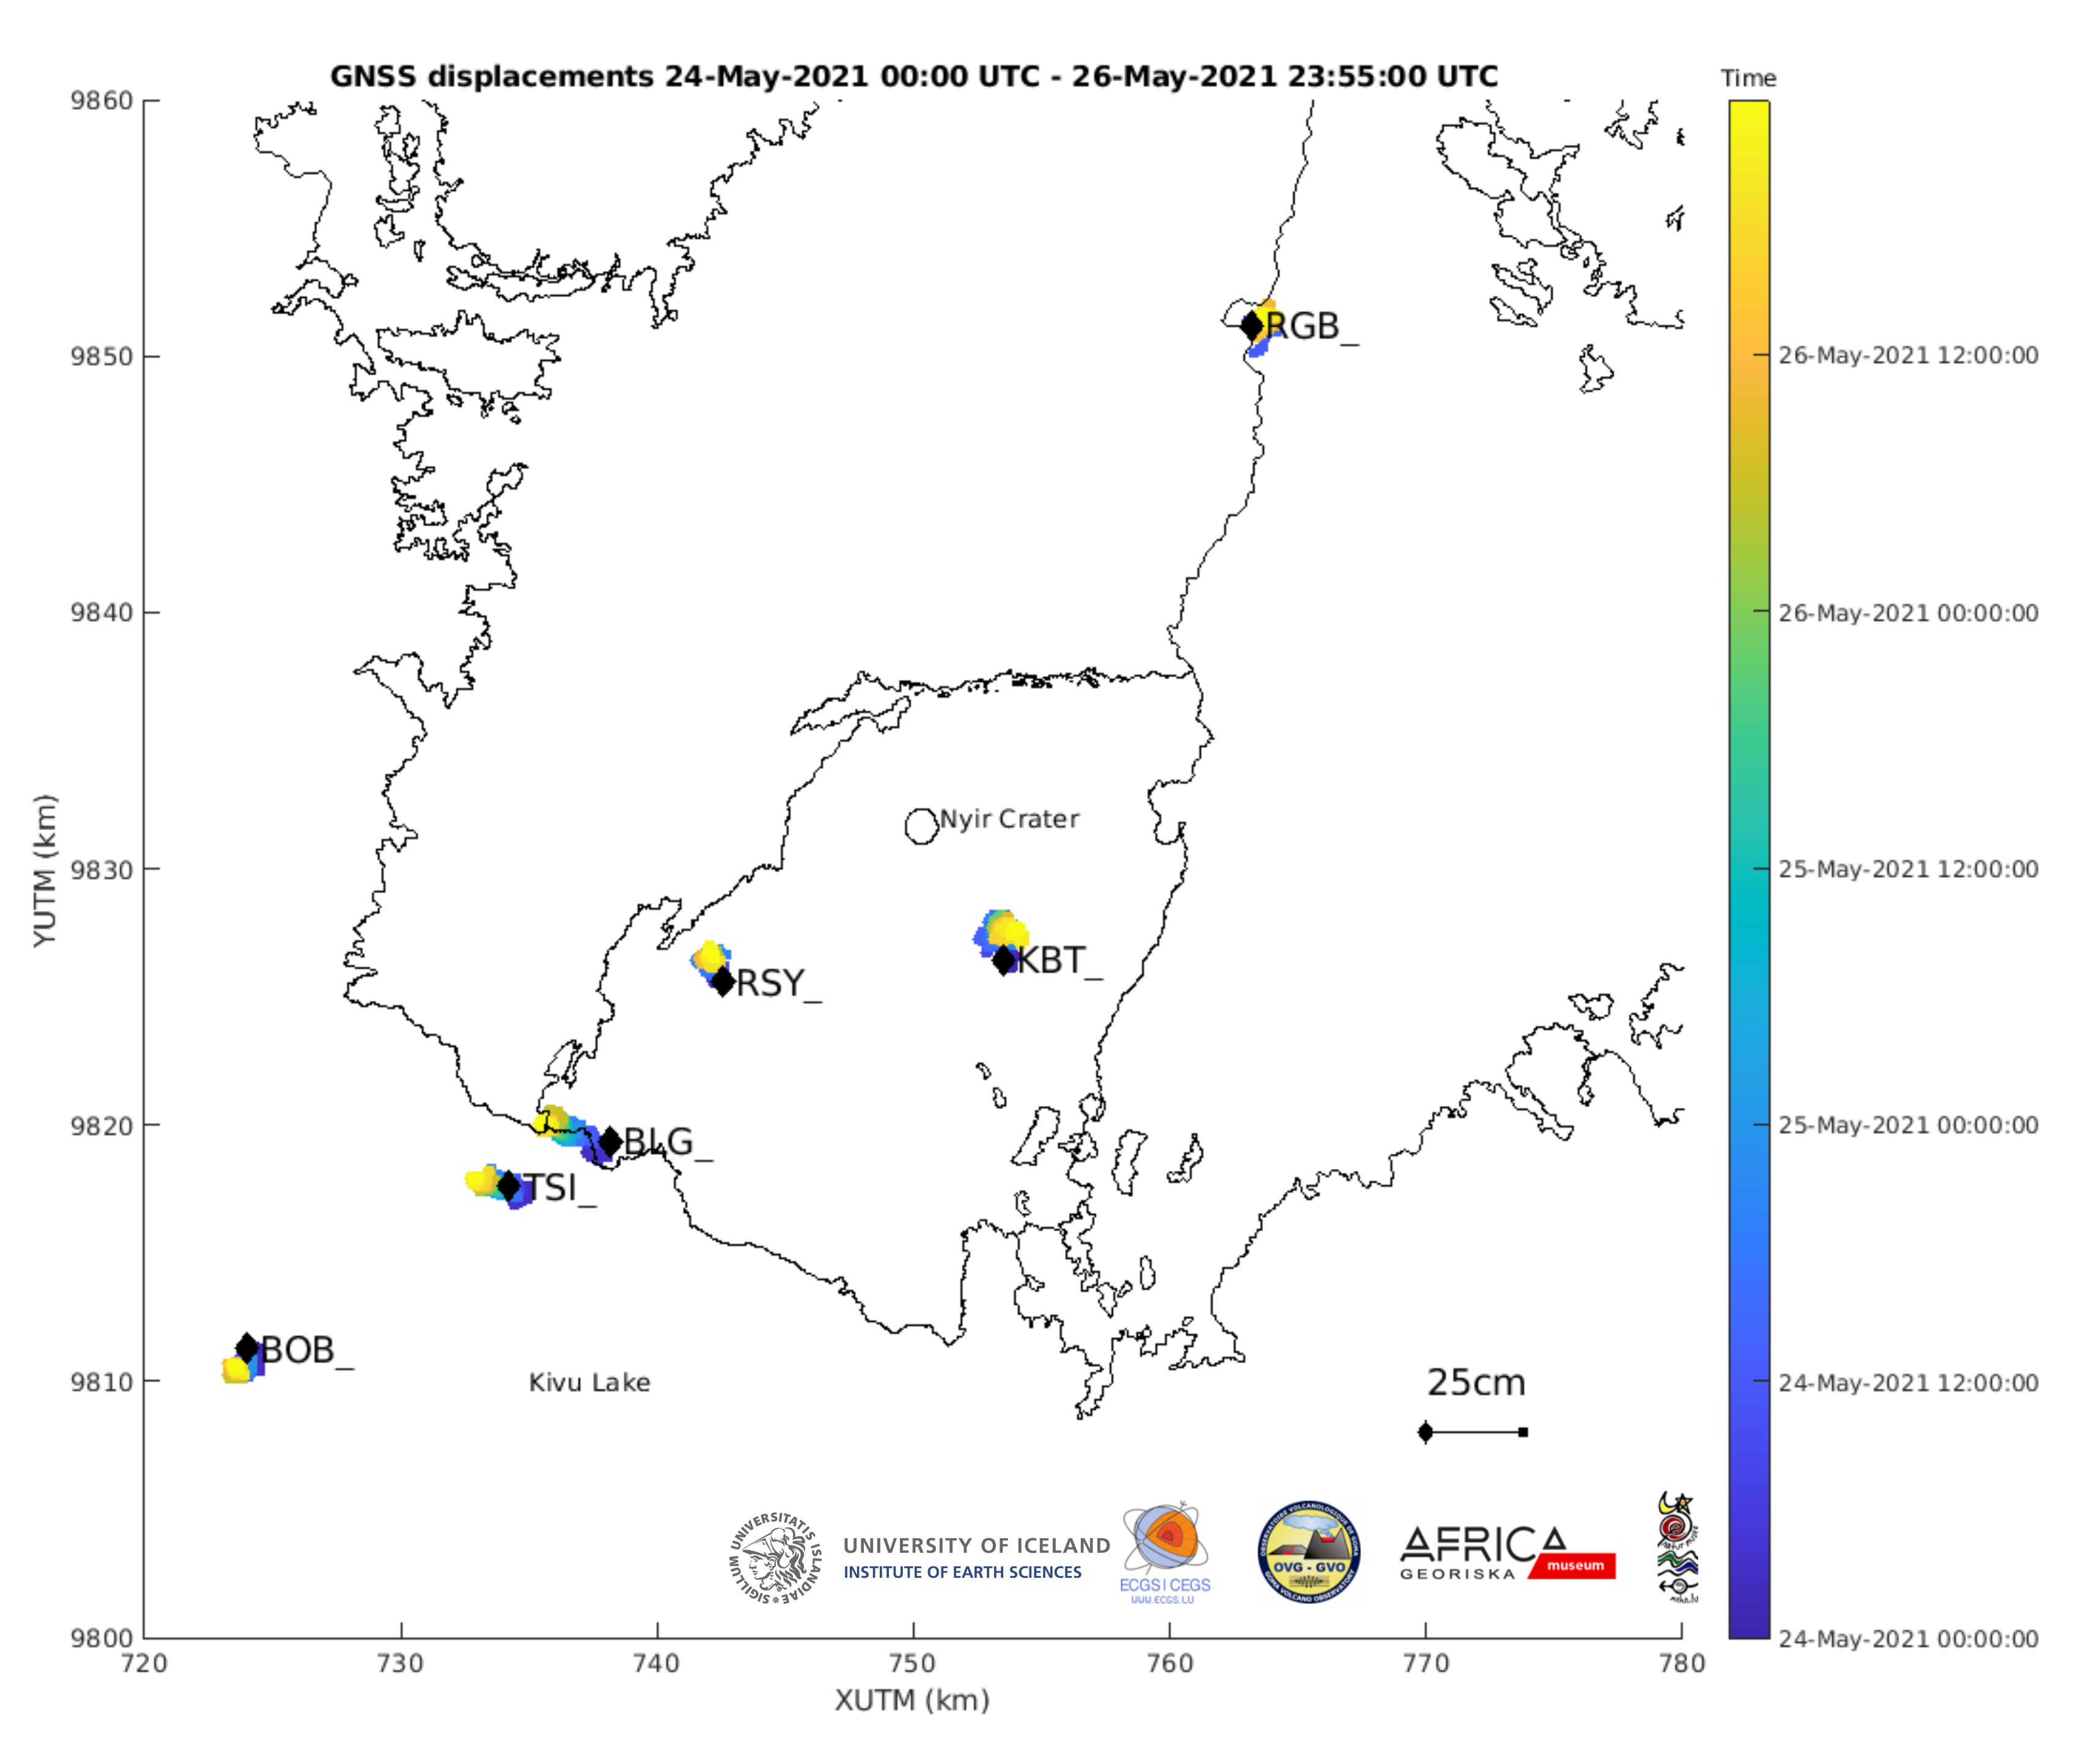
Figure 7: Map showing the horizontal displacements recorded by the GNSS stations of the KivuGNet network. Processing epoch by epoch, 1 point every 5 minutes between 24-05-2021 00:00 and 26-05-2021 23:55. The black contours mark the historical lava fields of Nyiragongo and Nyamulagira. Data processing by H. Geirsson (univ. Iceland).

Figure 8: Time series of east-west, north-south and vertical displacements between 24-05-2021 00:00 and 26-05-2021 23:55 for the 6 stations shown on the map above. Data processing by H. Geirsson (univ. Iceland).
![]()