2021-06-01 Follow up of the Nyiragongo eruption
Current earthquake (seismicity) and ground deformation data continue to indicate the presence of magma under the urban area of Goma with an extension under Lake Kivu.
Although there are still earthquakes recorded, their energy is globally lower. energy. However, there is some earthquake activity, mostly unfeeling, which is occurring southwards under Lake Kivu. The GPS network continues to show a decrease in displacement velocities The GPS network continues to show a decrease in displacement velocities measured at the stations. The physical impossibility of installing seismic or
The physical impossibility of installing seismic or GPS stations in the lake makes it impossible to accurately detect any upwelling of magma under the lake.
This decrease in energy released by the earthquakes, as well as in the GPS velocities, cannot yet be interpreted as indicating the cessation of magma. be interpreted as indicating the cessation of volcanic activity. During phases of volcanic activity, periods of higher activity often alternate with phases of lower activity.
Satellite imagery is used to measure ground deformation: the last data recorded recorded 45 minutes before the eruption on 22 May showed no deformation, which confirms the absence of This confirms the absence of precursors to the eruption.
On the other hand, new satellite data recorded between 25 and 31 May underline the absence of deformation on the flanks of Nyiragongo and indicate that the ground continues to deform south of the city of Goma, albeit to a lesser extent than at the beginning of the eruption. These deformations may still create or extend existing ground fractures.
New landslides in the crater may cause ash fallout in the surrounding areas.
The possibility of an eruption on land or under the lake cannot be ruled out at this time, especially as some eruptions can occur with few precursors.
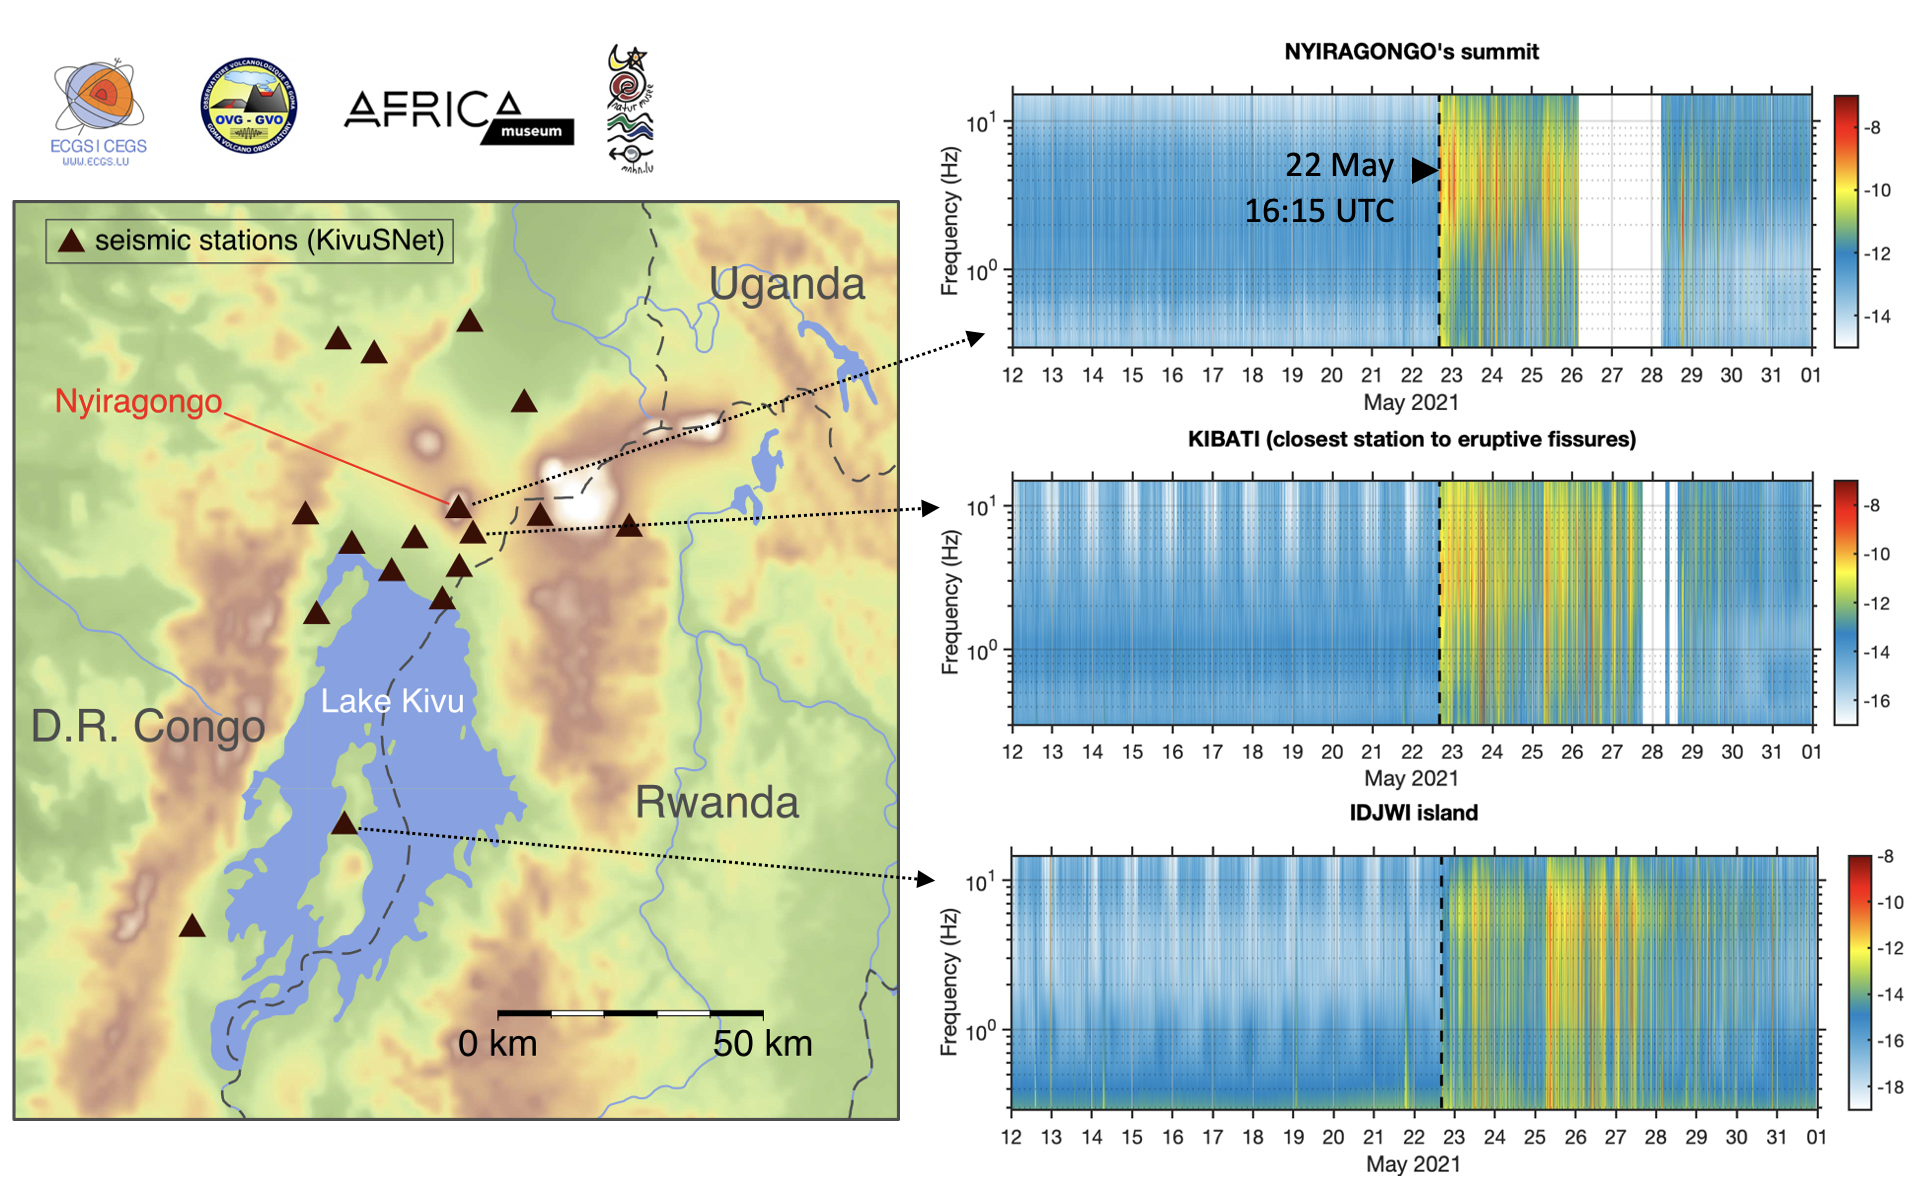
Figure 1: left) Map of seismic stations, right) Seismic records depicted as time-frequency images called Power Spectral Density (the amplitude of each frequency component of the seismic signals is indicated with the color scale, the strongest amplitude in red, the unit is log10[m^(2).s^(-2)/Hz]). The 3 stations showed here are NYI (Nyiragongo's summit), KBTI (Kibati, the closest to the eruptive fissures) and IDJ (Idjwi Island, in the middle of lake Kivu). The intense seismic activity synchronous with the start of the eruption is indicated with the dahed line (22 May 2021, 16:15 UTC).
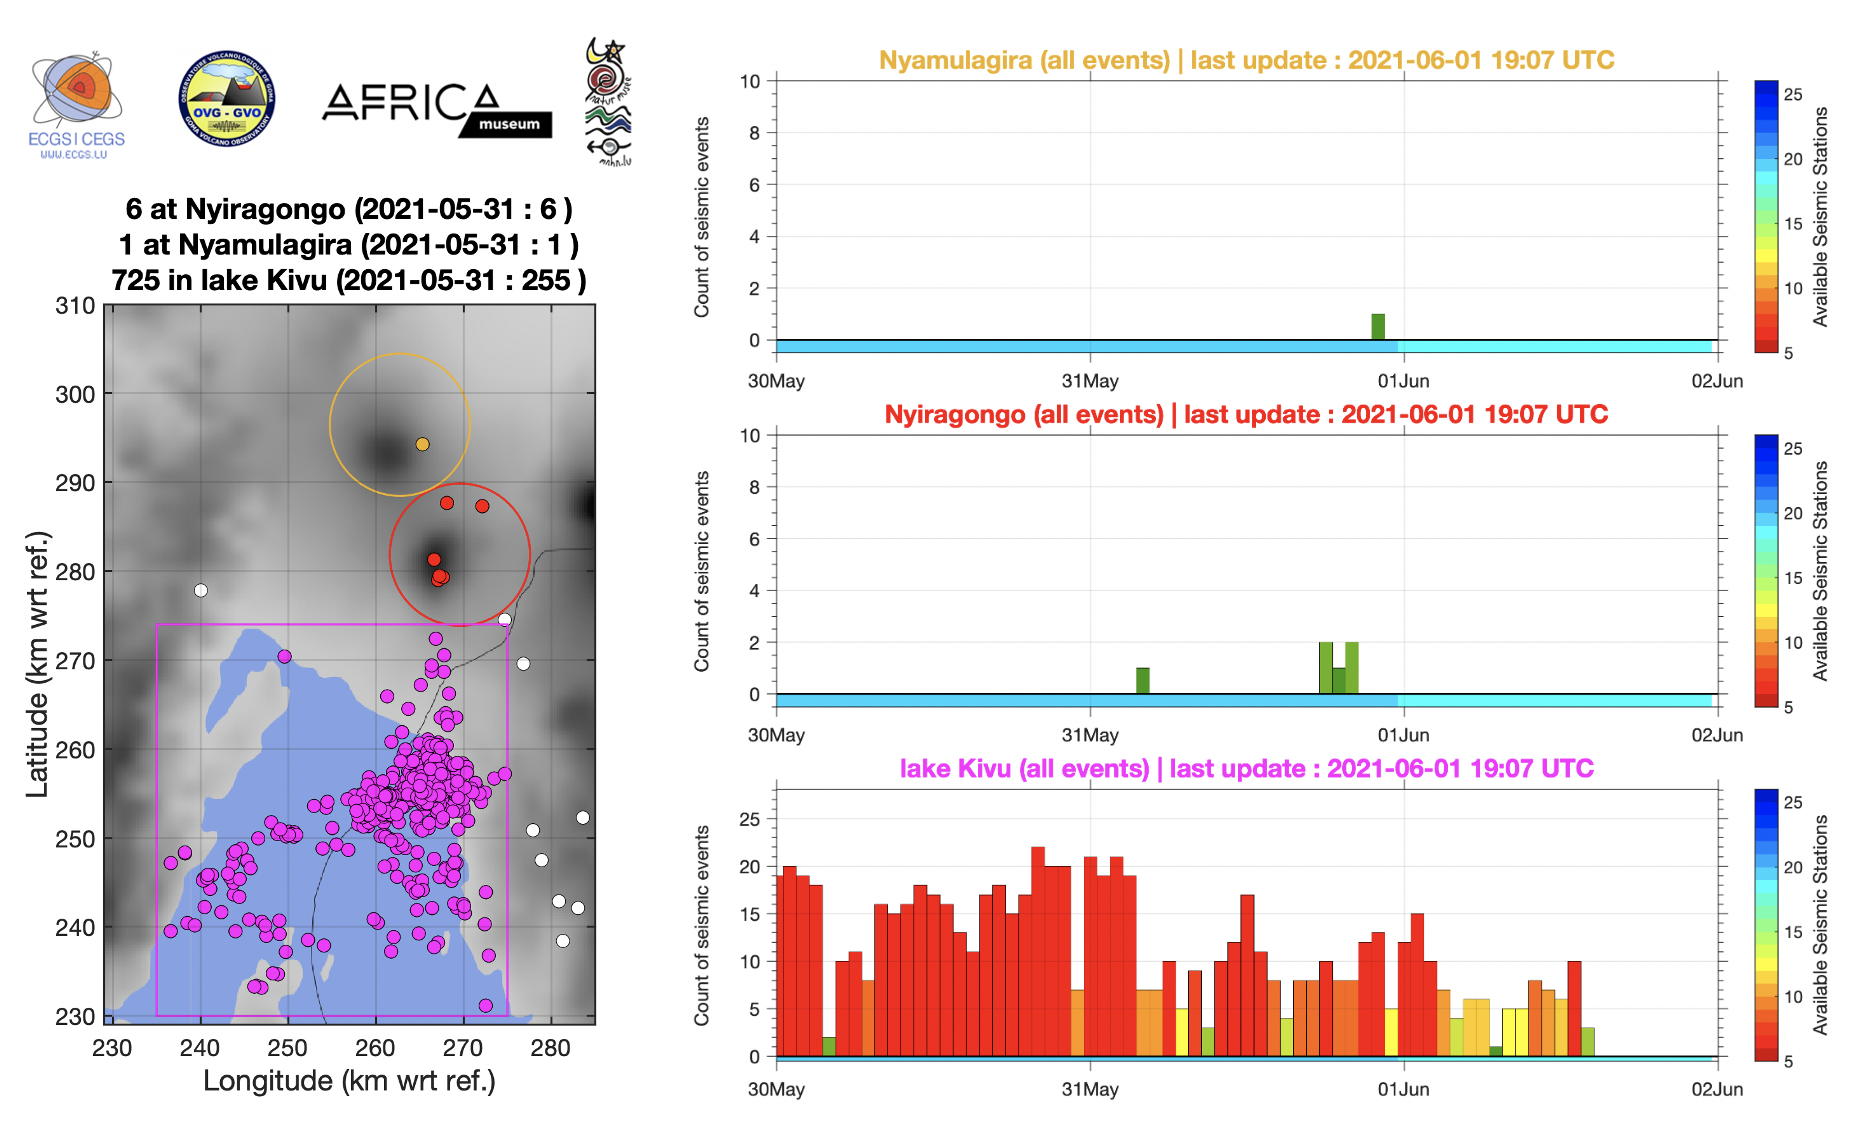
Figure 2: left) Zones for counting seismic events and right) automatic hourly counts of all earthquakes located in the three areas marked on the map during the last 3 days (from midnight 29 May; last updated on 31 May at 21:09 UTC). Each bar is an hourly count.
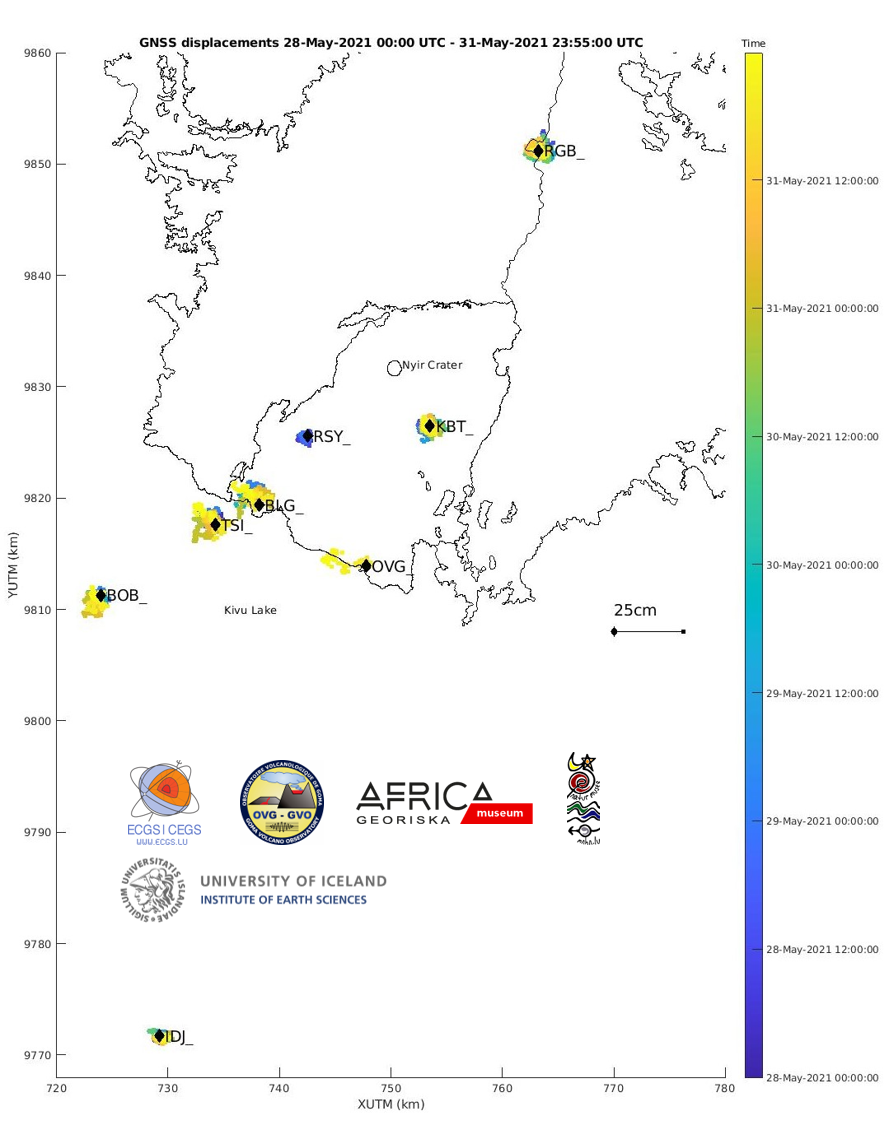
Figure 3: Map showing the horizontal displacements recorded by the GNSS stations of the KivuGNet network. Processing epoch by epoch, 1 point every 5 minutes between 28-05-2021 00:00 and 31-05-2021 23:55. The black contours mark the historical lava fields of Nyiragongo and Nyamulagira. Data processing by H. Geirsson (univ. Iceland).
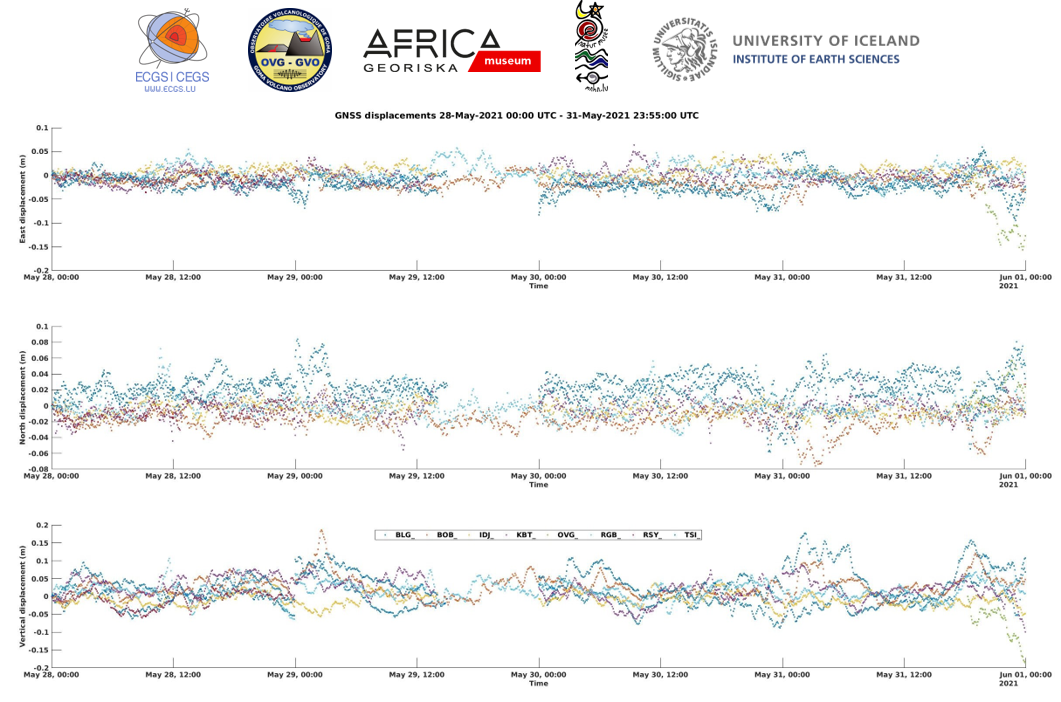
Figure 4: Time series of east-west, north-south and vertical displacements between 28-05-2021 00:00 and 31-05-2021 23:55 for the 6 stations shown on the map above. Data processing by H. Geirsson (univ. Iceland).
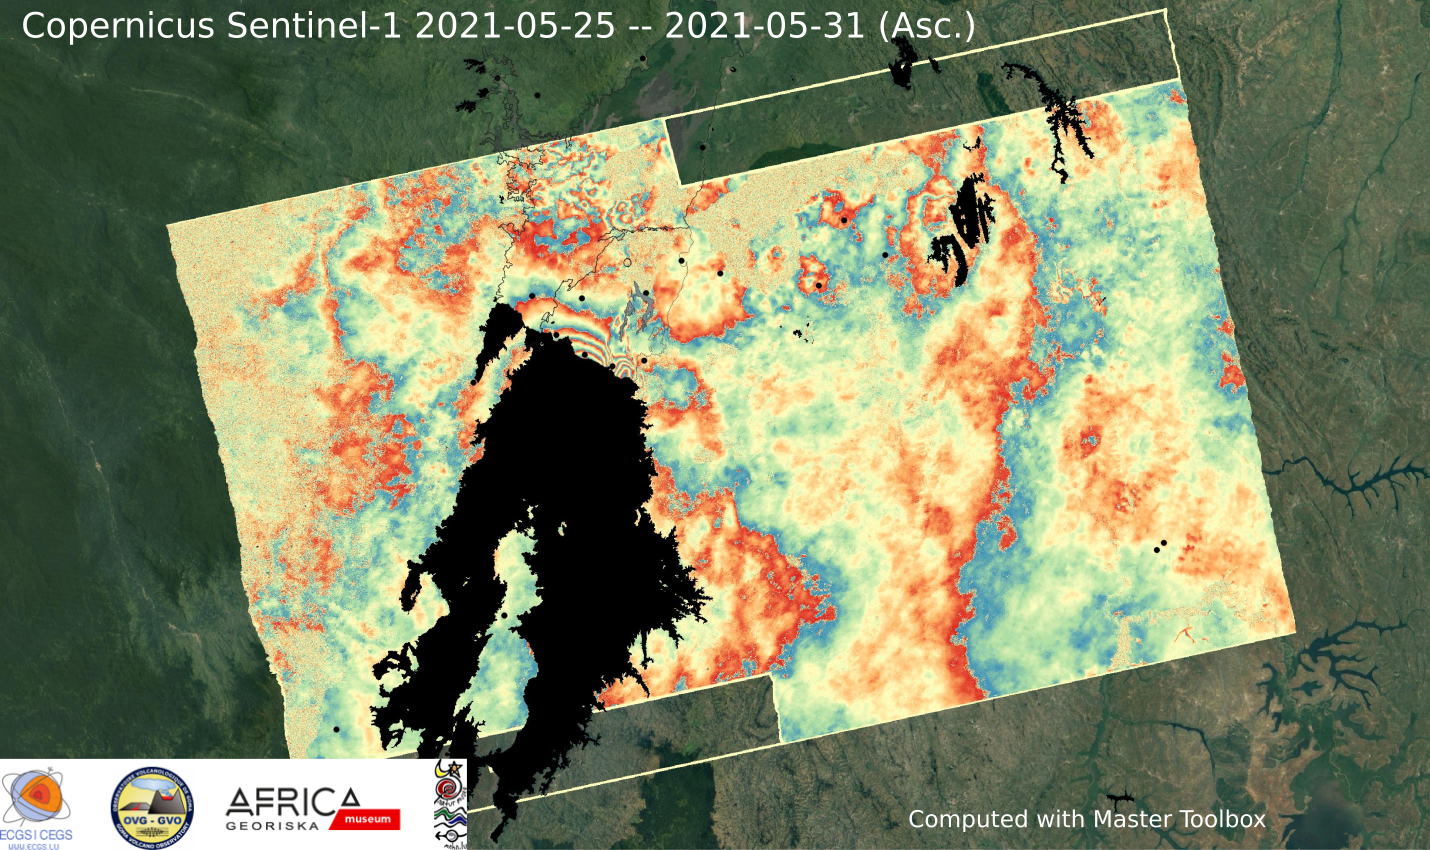
Figure 5: This interferogram has been computed with the MasTer Toolbox using two Copernicus Sentinel-1 scenes acquired 6 days apart, respectively on May 25th and May 31th. Each fringe corresponds to 3 cm of ground displacement in the line of sight (LOS) of the satellite. Images were acquired along the ascending orbit number 174 with an incidence angle at median slant range of 37 degrees. This image shoes that the ground deformation has progressed toward the South compared to the last satellite acquisition on May 27. Modelling the source of these deformations will help to assess the possible evolution of the crisis. The progression of the magma intrusion remains accompanied by seismicity.
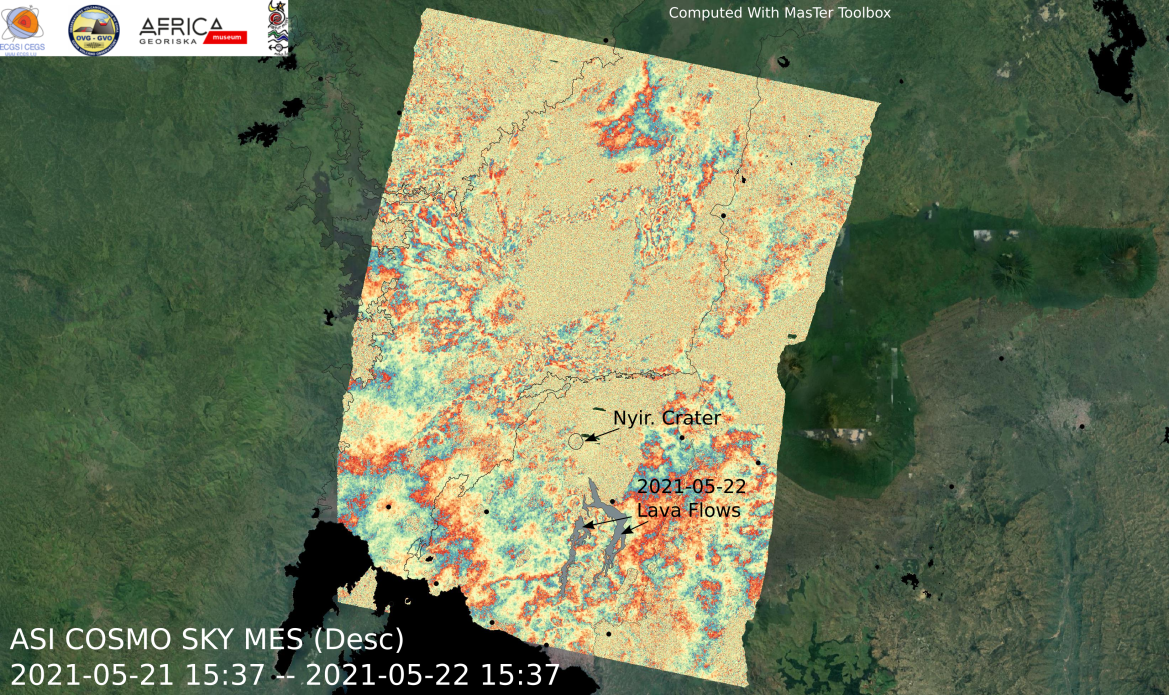
Figure 6: This interferogram has been computed with the MasTer Toolbox using two CosmoSkyMed scenes acquired 24 hours apart, respectively on May 21th and May 22th at 03:37pm UTC. Each fringe corresponds to 1.5 cm of ground displacement in the line of sight (LOS) of the satellite. Images were acquired along the descending orbit with an incidence angle at median slant range of 26 degrees. This image shoes that 45min before the eruption no deformation signal could be measured. CSK images are provided by GEO-GSNL, Virunga Supersite, and ASI. The flows formed by the eruption of 22/05/21 have been superimposed on the interferogram to provide a geographical reference.
![]()